


Project & Company Introduction
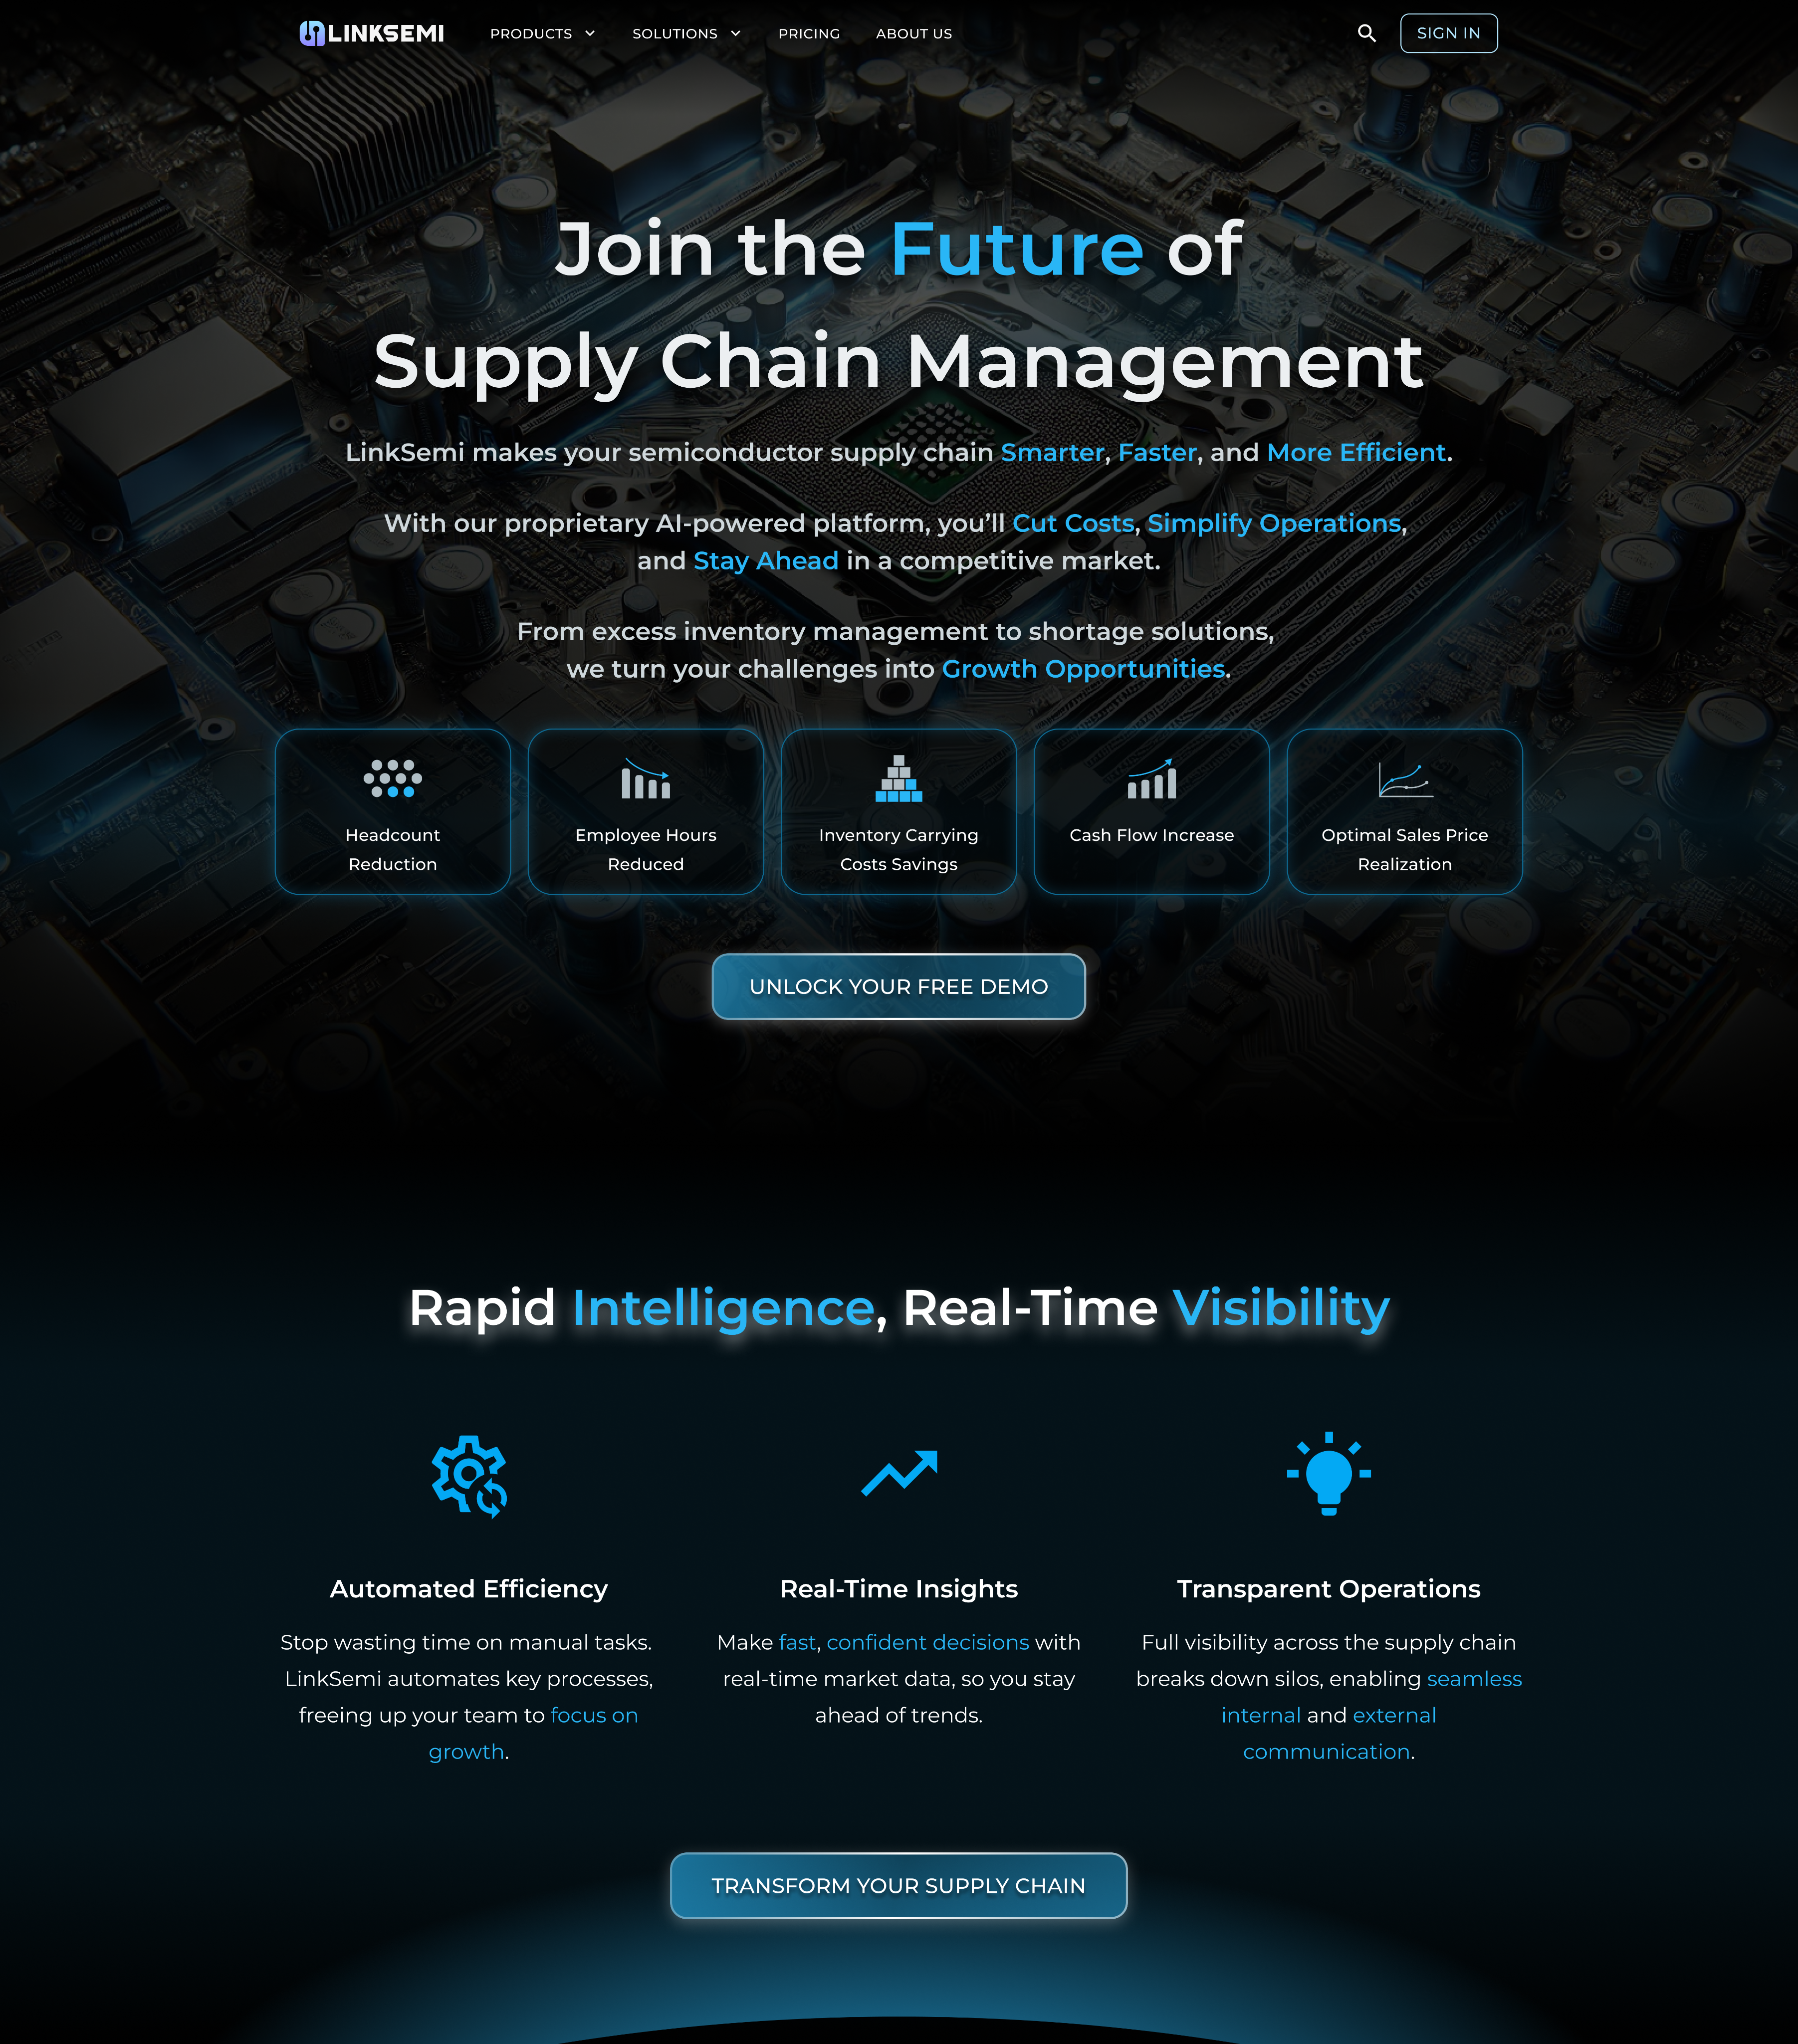
Linksemi was a B2B SaaS startup in the semiconductor industry, offering a peer-to-peer federated knowledge-sharing platform. Its core mission was to mitigate supply chain risks by providing real-time market information, predicting fluctuations, and smoothing them out with the help of AI-powered and federated ML tools.
The platform allowed semiconductor companies to register, upload their component lists, and gain full visibility into the market. By participating anonymously, stakeholders could share insights, exchange components, and collaborate without exposing sensitive data. Automated workflows further streamlined communication between manufacturers, suppliers, and buyers, addressing the long-standing gaps of transparency and visibility in this space.
The product revolved around three key features:
- E&O (Excess & Obsolete) – for identifying surplus or outdated parts.
- Shortage – for detecting and solving critical component scarcities.
- PPV+ (Purchase Price Variance) – for analyzing and optimizing purchase prices across the market.
Together, these features empowered companies to upload, share, and negotiate on component lists — creating a more efficient, data-driven ecosystem for the semiconductor supply chain.
My Role in the Project
I joined Linksemi as the Product Designer and worked closely with the Product Manager throughout the entire product lifecycle. My responsibilities covered both the strategic definition of features and the hands-on design work.
Key areas of my contribution included:
- Feature Definition: Collaborated with the Product Manager to translate business needs into well-defined product features and user flows.
- User Experience & Interface Design: Designed end-to-end user journeys for the three core features (E&O, Shortage, and PPV+), ensuring usability for B2B stakeholders handling complex data sets.
- UI System & Visual Design: Built consistent interface patterns and a design system to scale the dashboard experience across different features.
- Marketing Design: Created visual assets and graphic elements to support the company’s marketing and communication efforts.
Over the course of 1 year and 9 months, I contributed to shaping the product vision, making design decisions that improved usability and clarity, and ensuring the platform could handle the complexities of large-scale B2B data while remaining intuitive for end users.
Key Features of the Platform
The platform was built around a set of core features designed to support semiconductor companies in managing their components and supply chain risks:
- Reports Page – A centralized dashboard that visualizes insights from uploaded component lists, such as availability, compliance, pricing, and lifecycle risks.
- E&O (Excess & Obsolete) – Helps companies identify surplus or outdated parts and connect with potential buyers to reduce waste and recover value.
- Shortage – Enables users to detect critical component shortages, share requirements, and receive supplier offers to secure parts faster.
- PPV+ (Purchase Price Variance) – Provides real-time analysis of purchase prices against market benchmarks, helping companies optimize procurement strategies.
- AI Assistant – An intelligent chatbot that allows users to interact with the system conversationally, ask complex questions, and receive instant data-driven insights.
Together, these features created a comprehensive SaaS solution that combined advanced data analysis with practical workflows to make the semiconductor supply chain more transparent, efficient, and resilient.
Reports Page
The Reports Page acted as the analytical core of the platform. Whenever a company uploaded a component list, the system automatically processed the data and generated a comprehensive report. This page was designed to transform raw data into clear, actionable insights through visual dashboards and metrics.
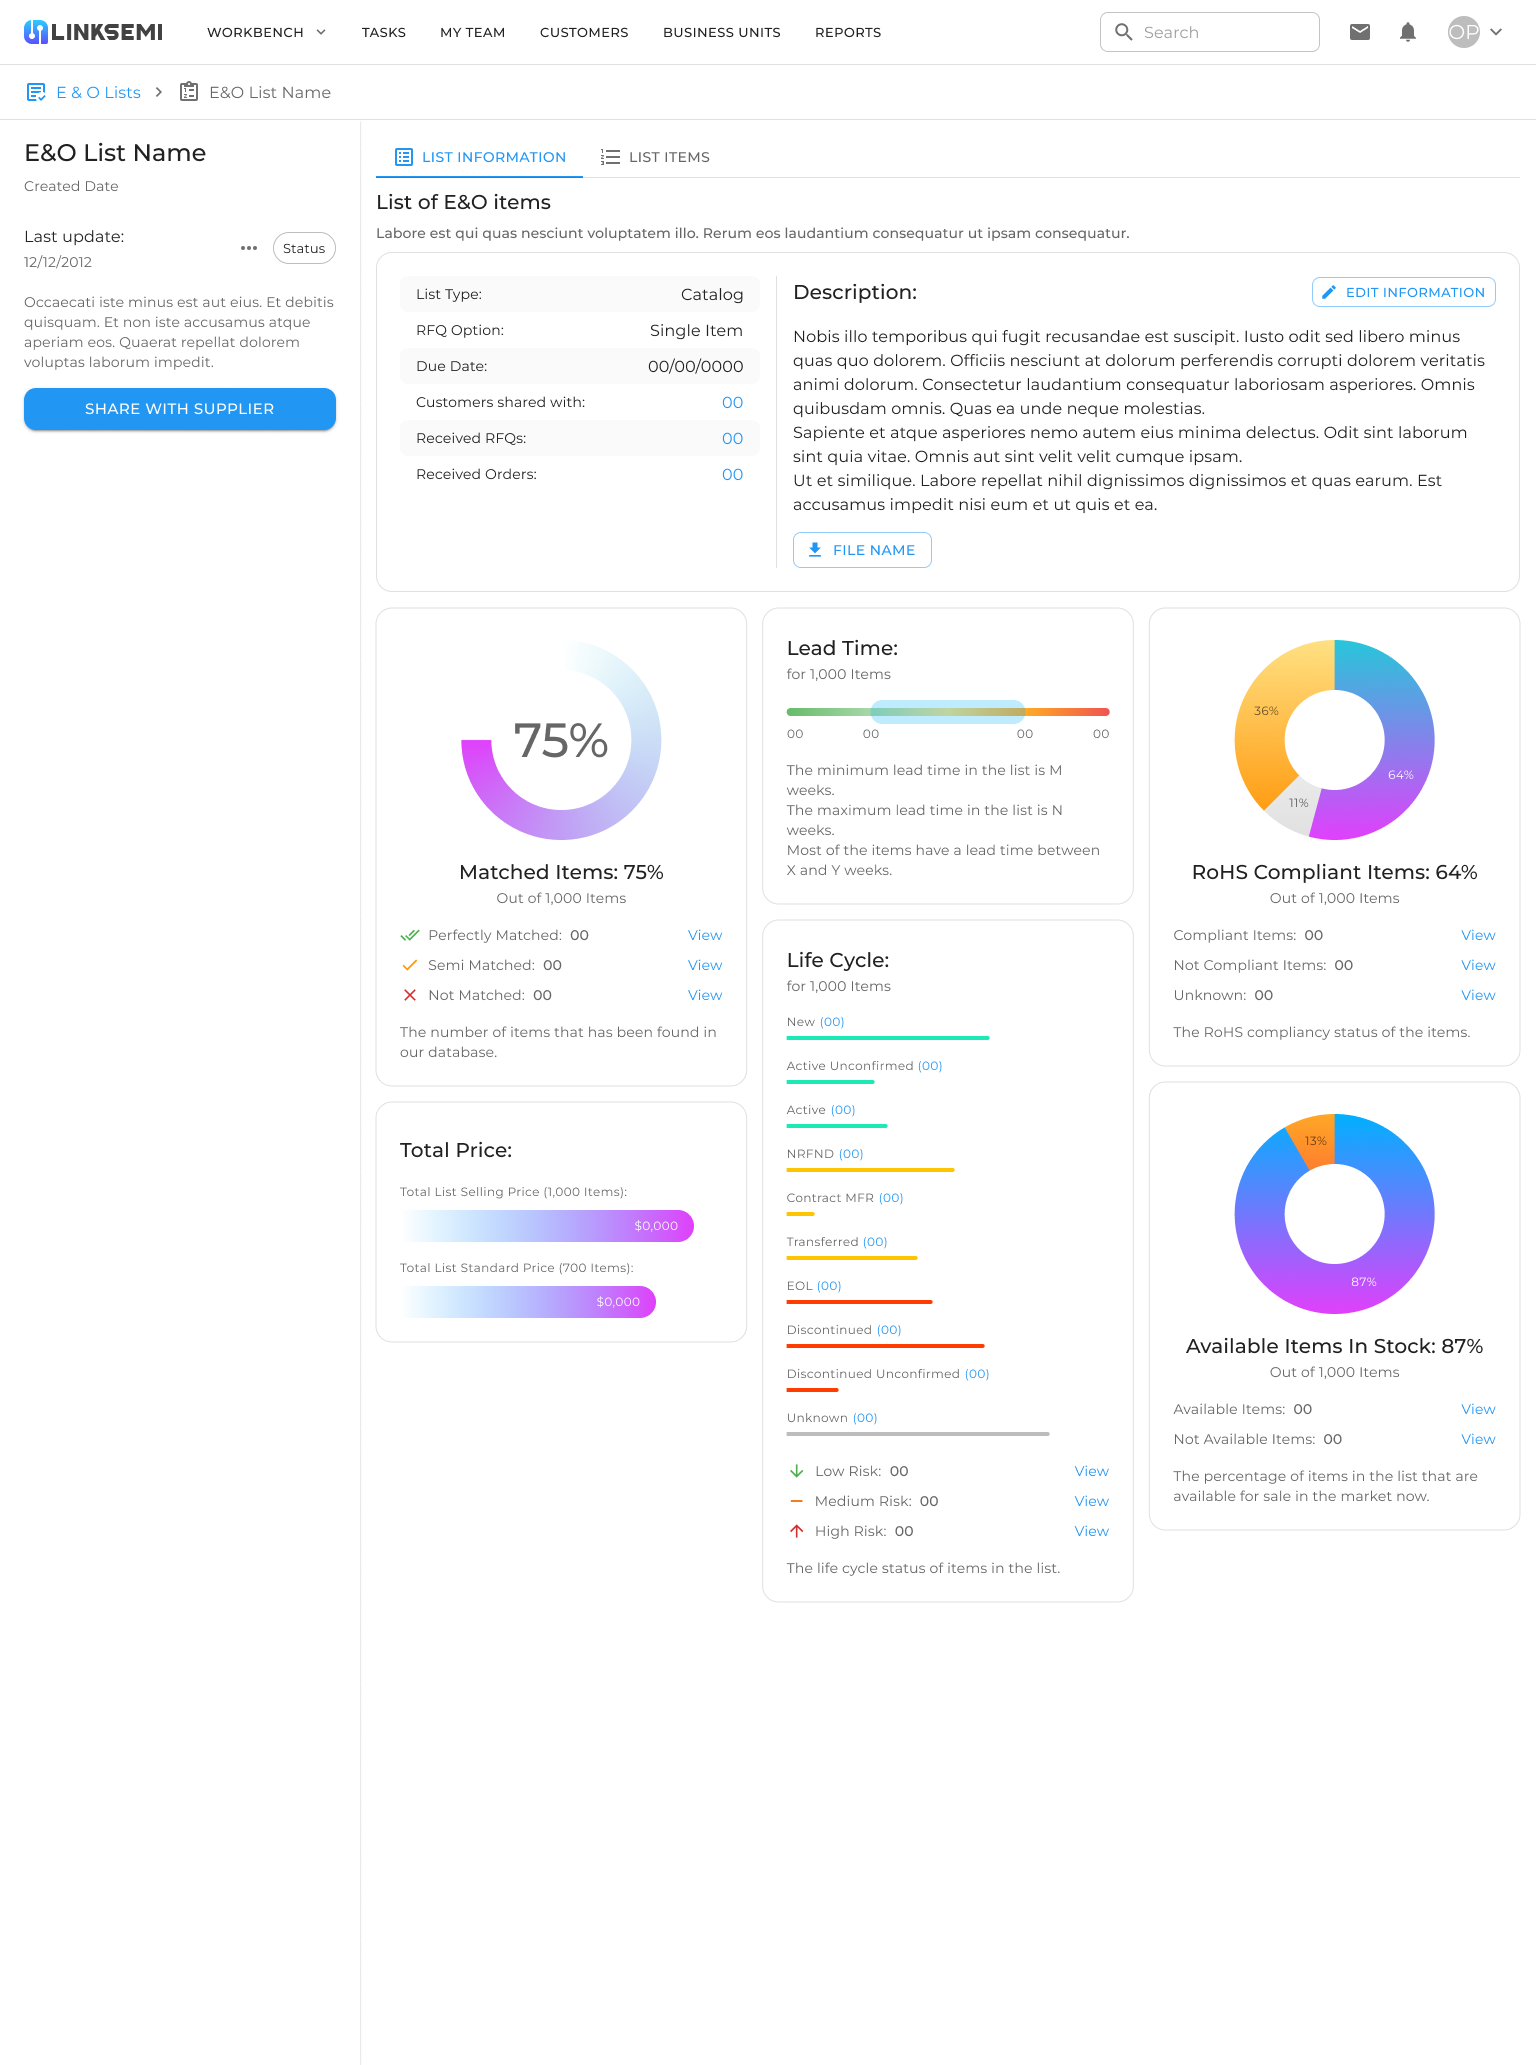
Key elements included:
- Match Rate – Showed what percentage of the uploaded items were found in the global database, with a breakdown of perfectly matched, semi-matched, and unmatched items.
- Lead Time – Displayed the shortest and longest lead times for listed items, helping companies anticipate delays in the supply chain.
- Lifecycle Status – Categorized items as active, discontinued, or end-of-life, and flagged components with low, medium, or high risk.
- RoHS Compliance – Indicated whether parts complied with environmental regulations, an essential factor for global trade.
- Stock Availability – Revealed what proportion of items were currently available in the market, highlighting possible shortages.
- Total Price Analysis – Compared the list’s standard price with the selling price, helping buyers and sellers evaluate pricing strategies.
By consolidating all this information in a single dashboard, the Reports Page gave users a 360-degree view of their inventory health. Beyond analysis, users could also share reports directly with suppliers, turning insights into immediate opportunities for negotiation or collaboration.
E&O (Excess & Obsolete)
The E&O feature was designed to help companies identify and manage surplus or obsolete components in their inventory. In the semiconductor industry, holding excess parts not only ties up capital but also creates a risk of waste if those items lose relevance or reach end-of-life.
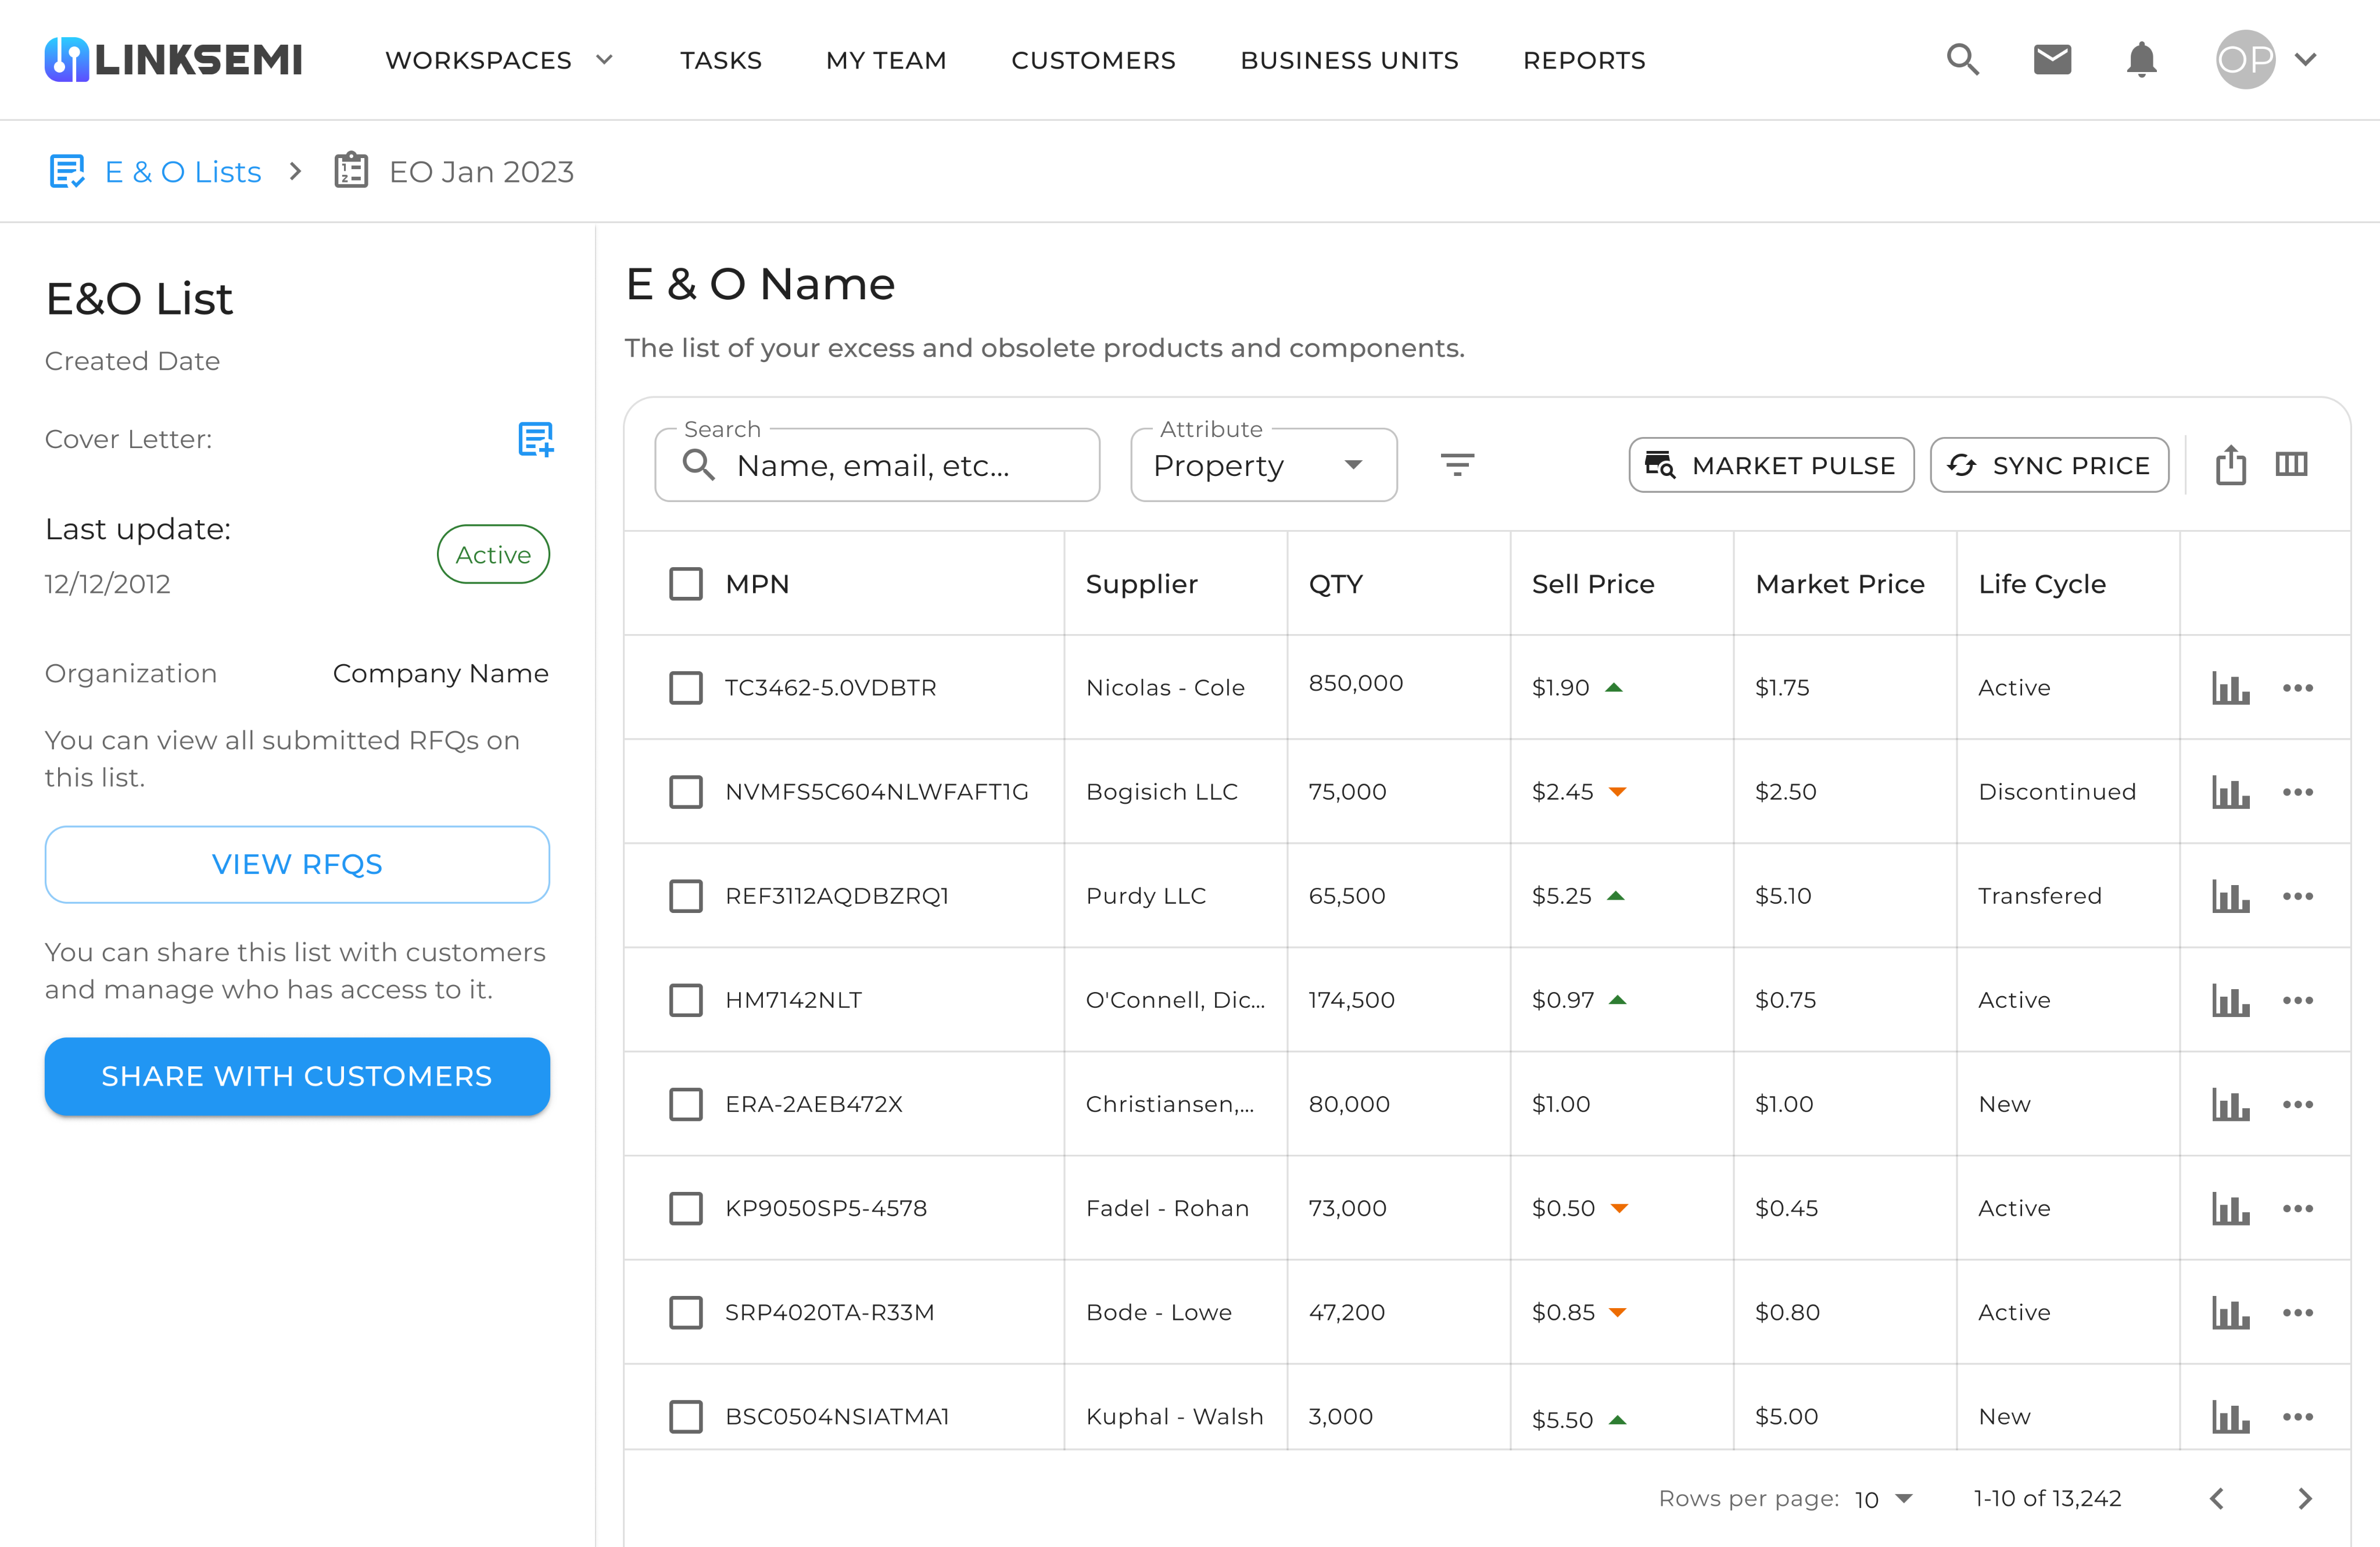
E&O List Page
This page displays the list of Excess & Obsolete (E&O) components. Each item includes details such as supplier, quantity, selling price, market price, and lifecycle status. Features like Market Pulse and Sync Price allow users to keep pricing updated and quickly identify trading opportunities.
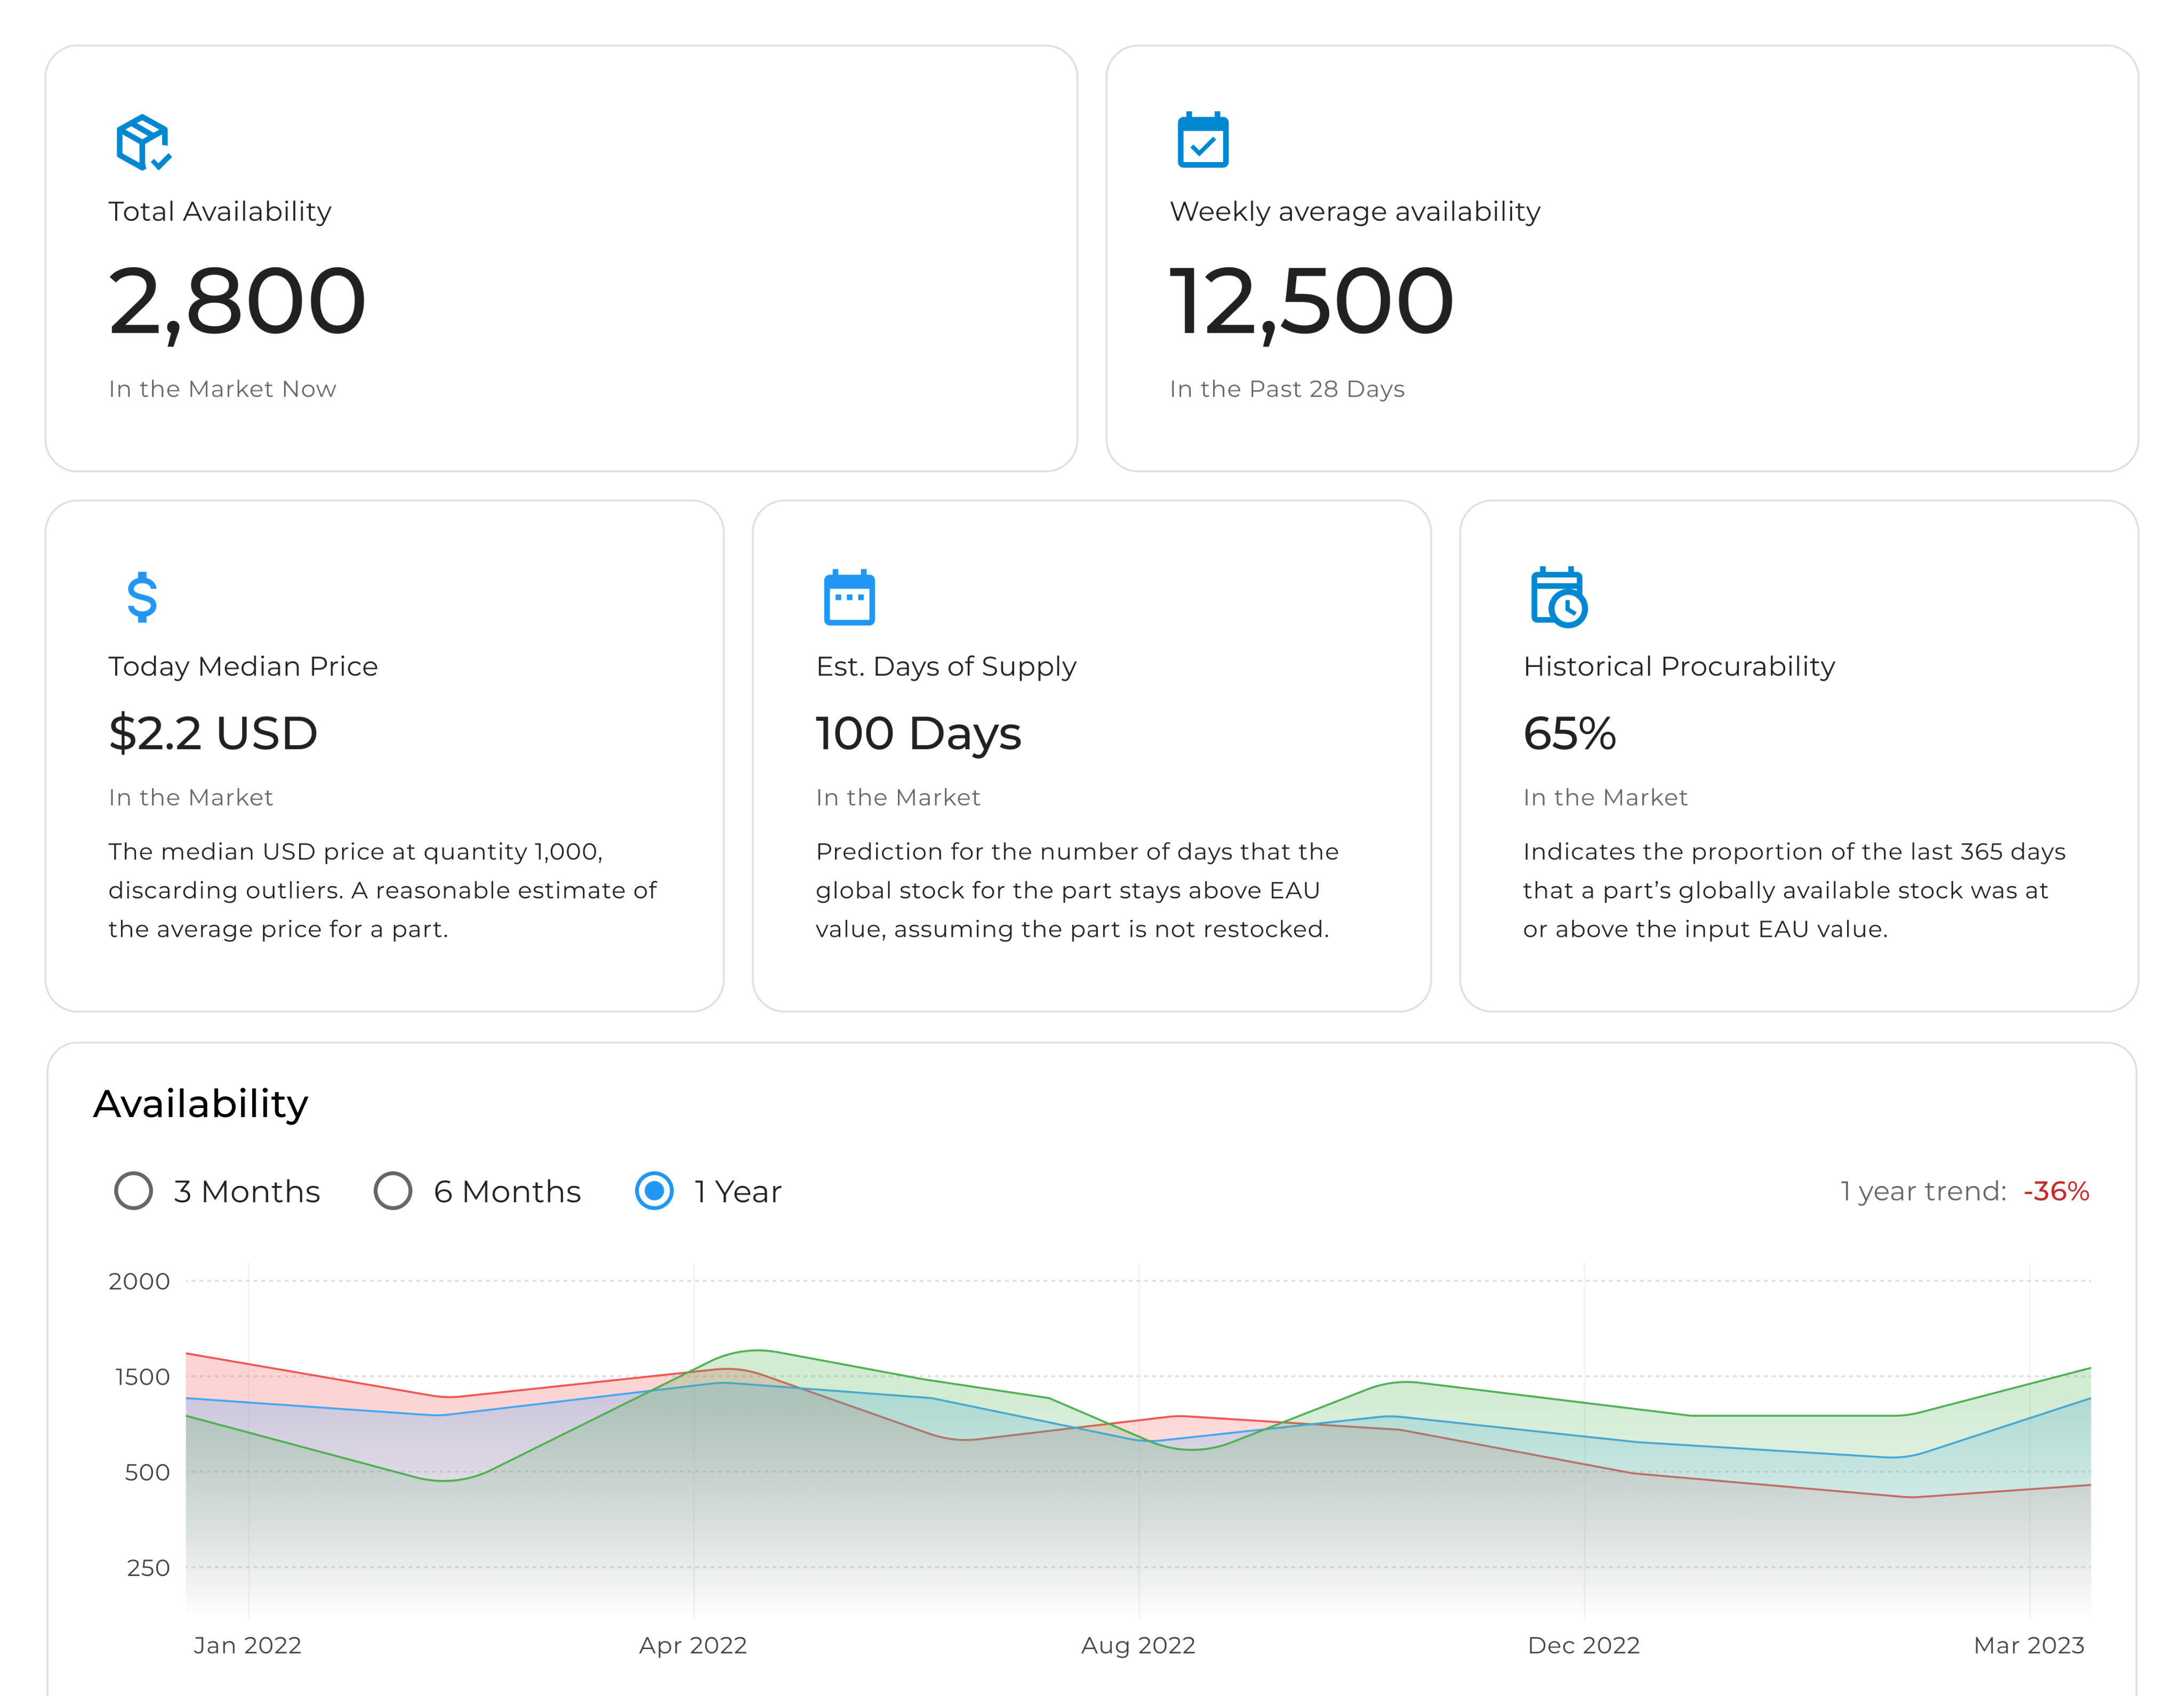
Availability & Market Insights
This analytical dashboard provides insights into global availability and pricing trends. Key metrics include total availability, weekly averages, today’s median price, estimated days of supply, and historical procurability. The Availability Trend chart visualizes changes over time, helping companies evaluate risks and anticipate market fluctuations.
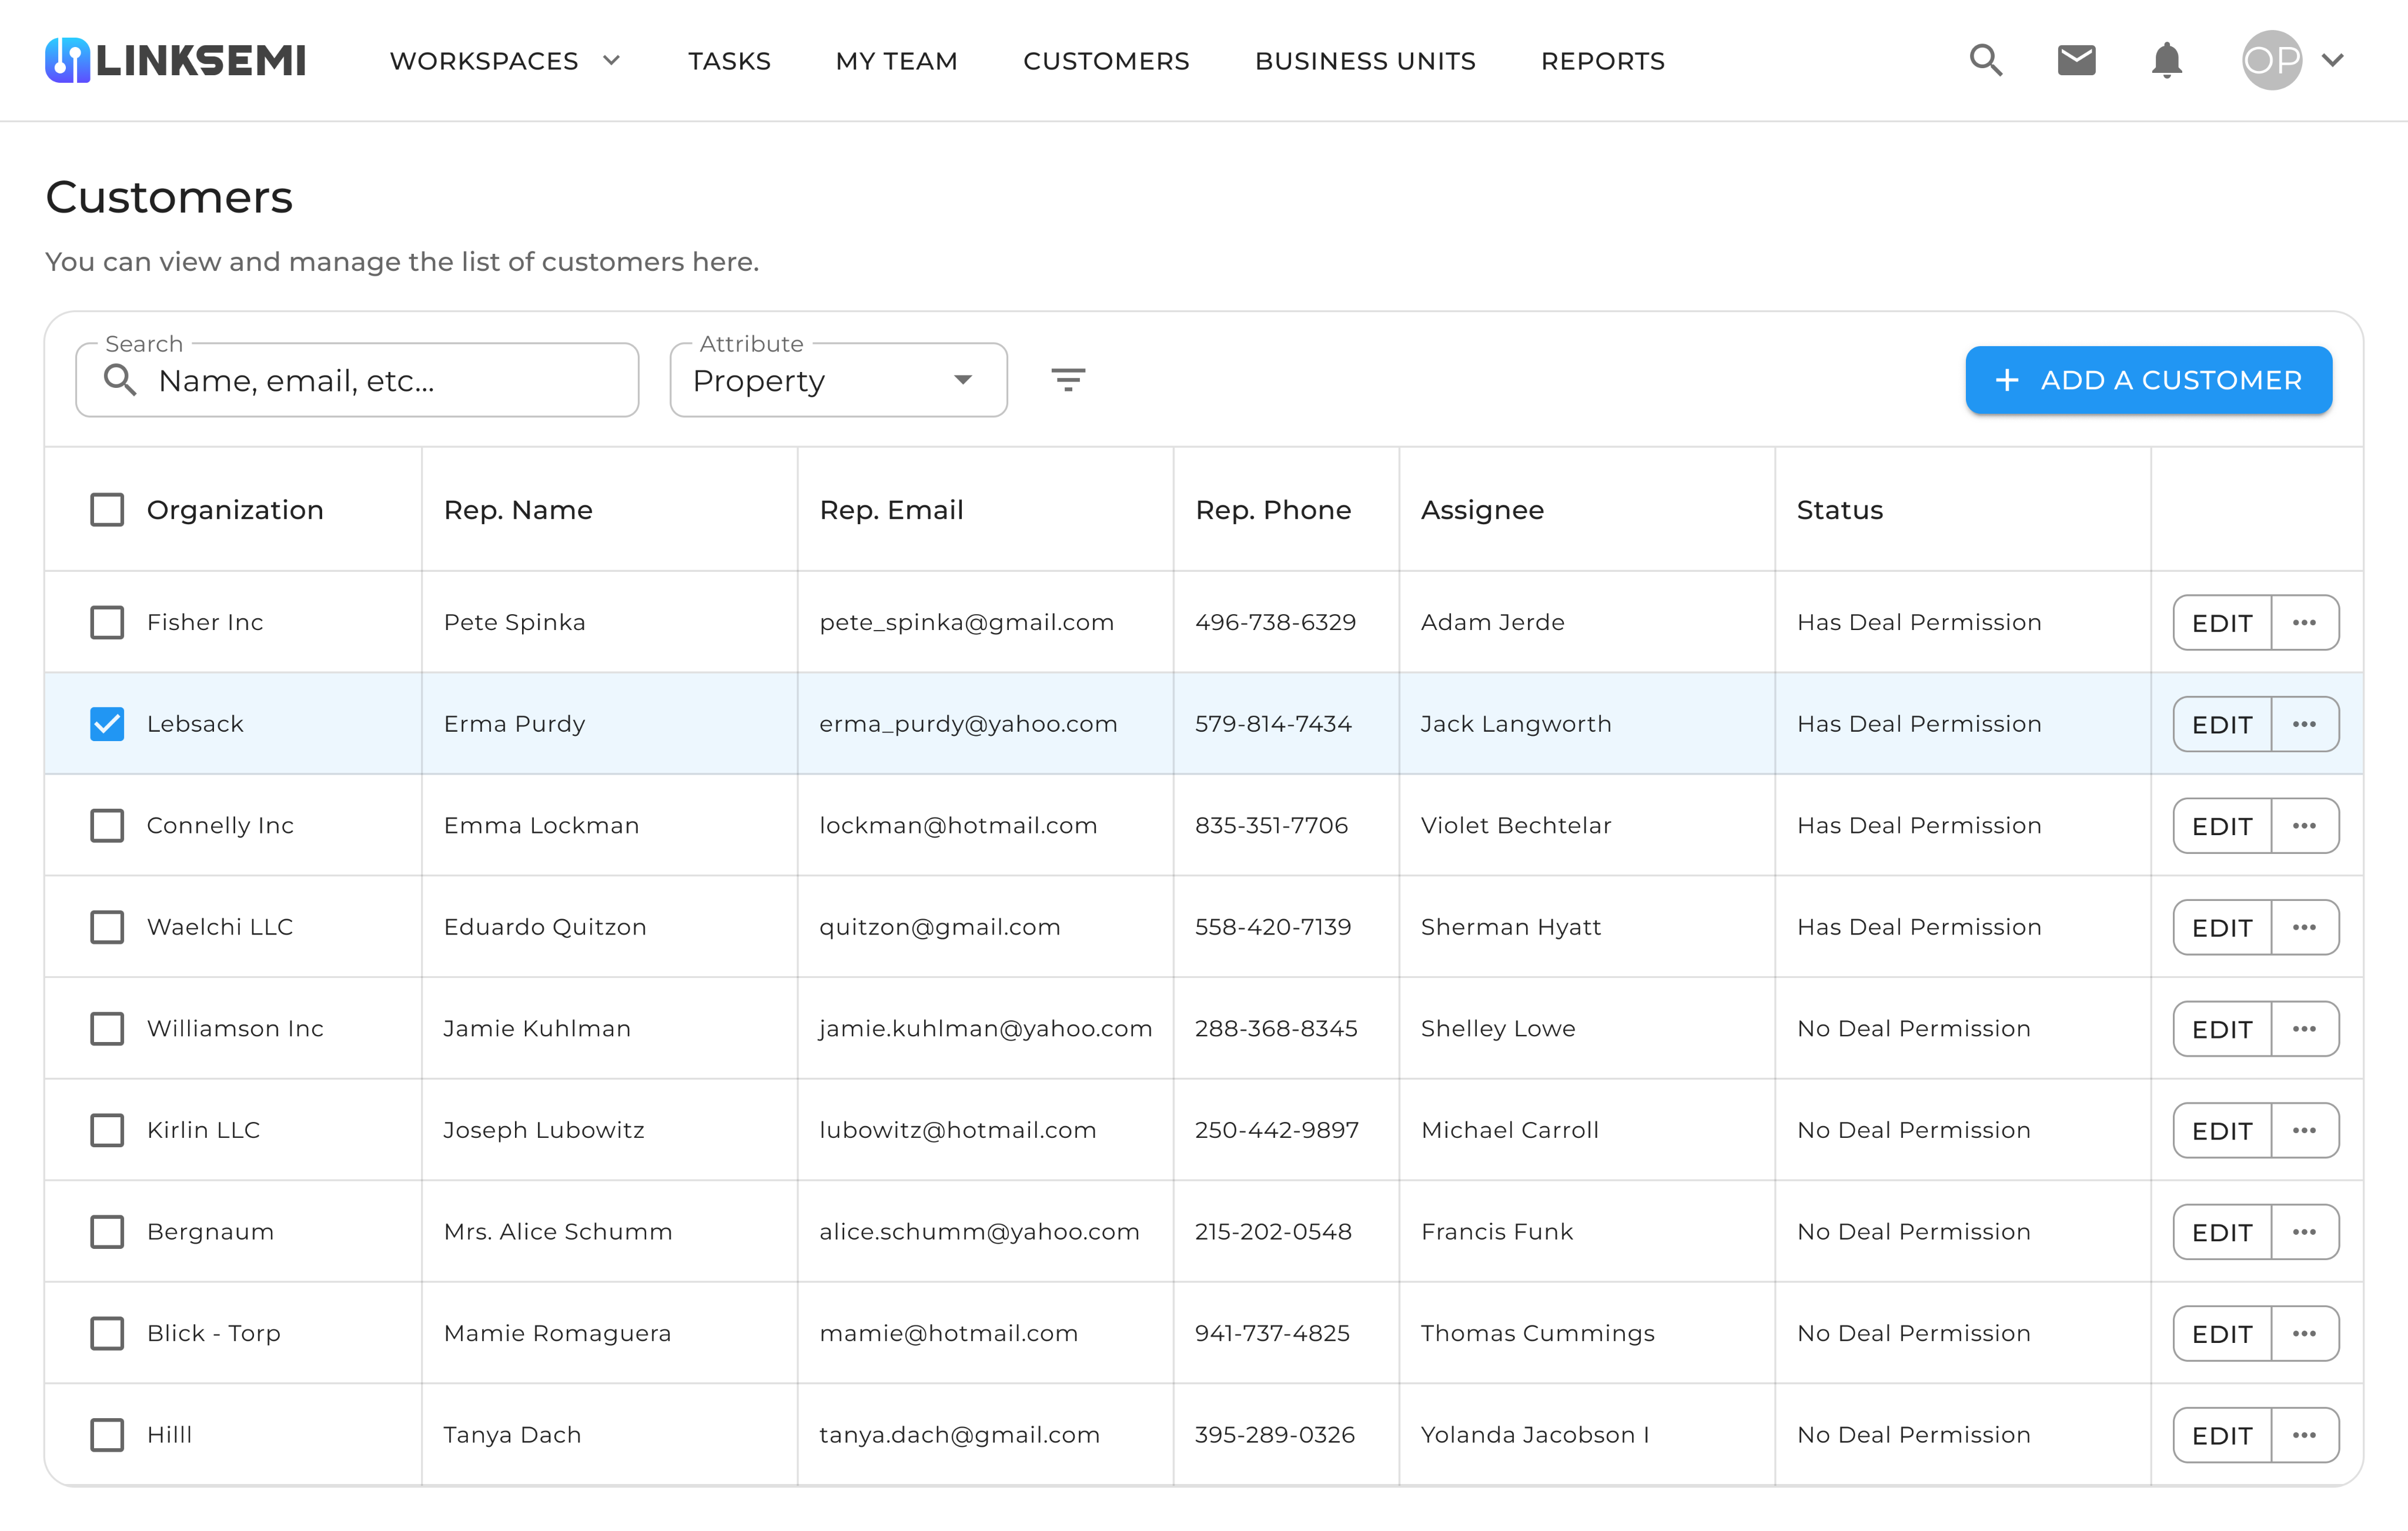
Customers Management
This section helps companies manage their customer base. Users can view and edit customer information such as organization, representative, email, phone number, and deal permissions. It provides structure and clarity for organizing client relationships and tracking who is eligible to engage in deals.
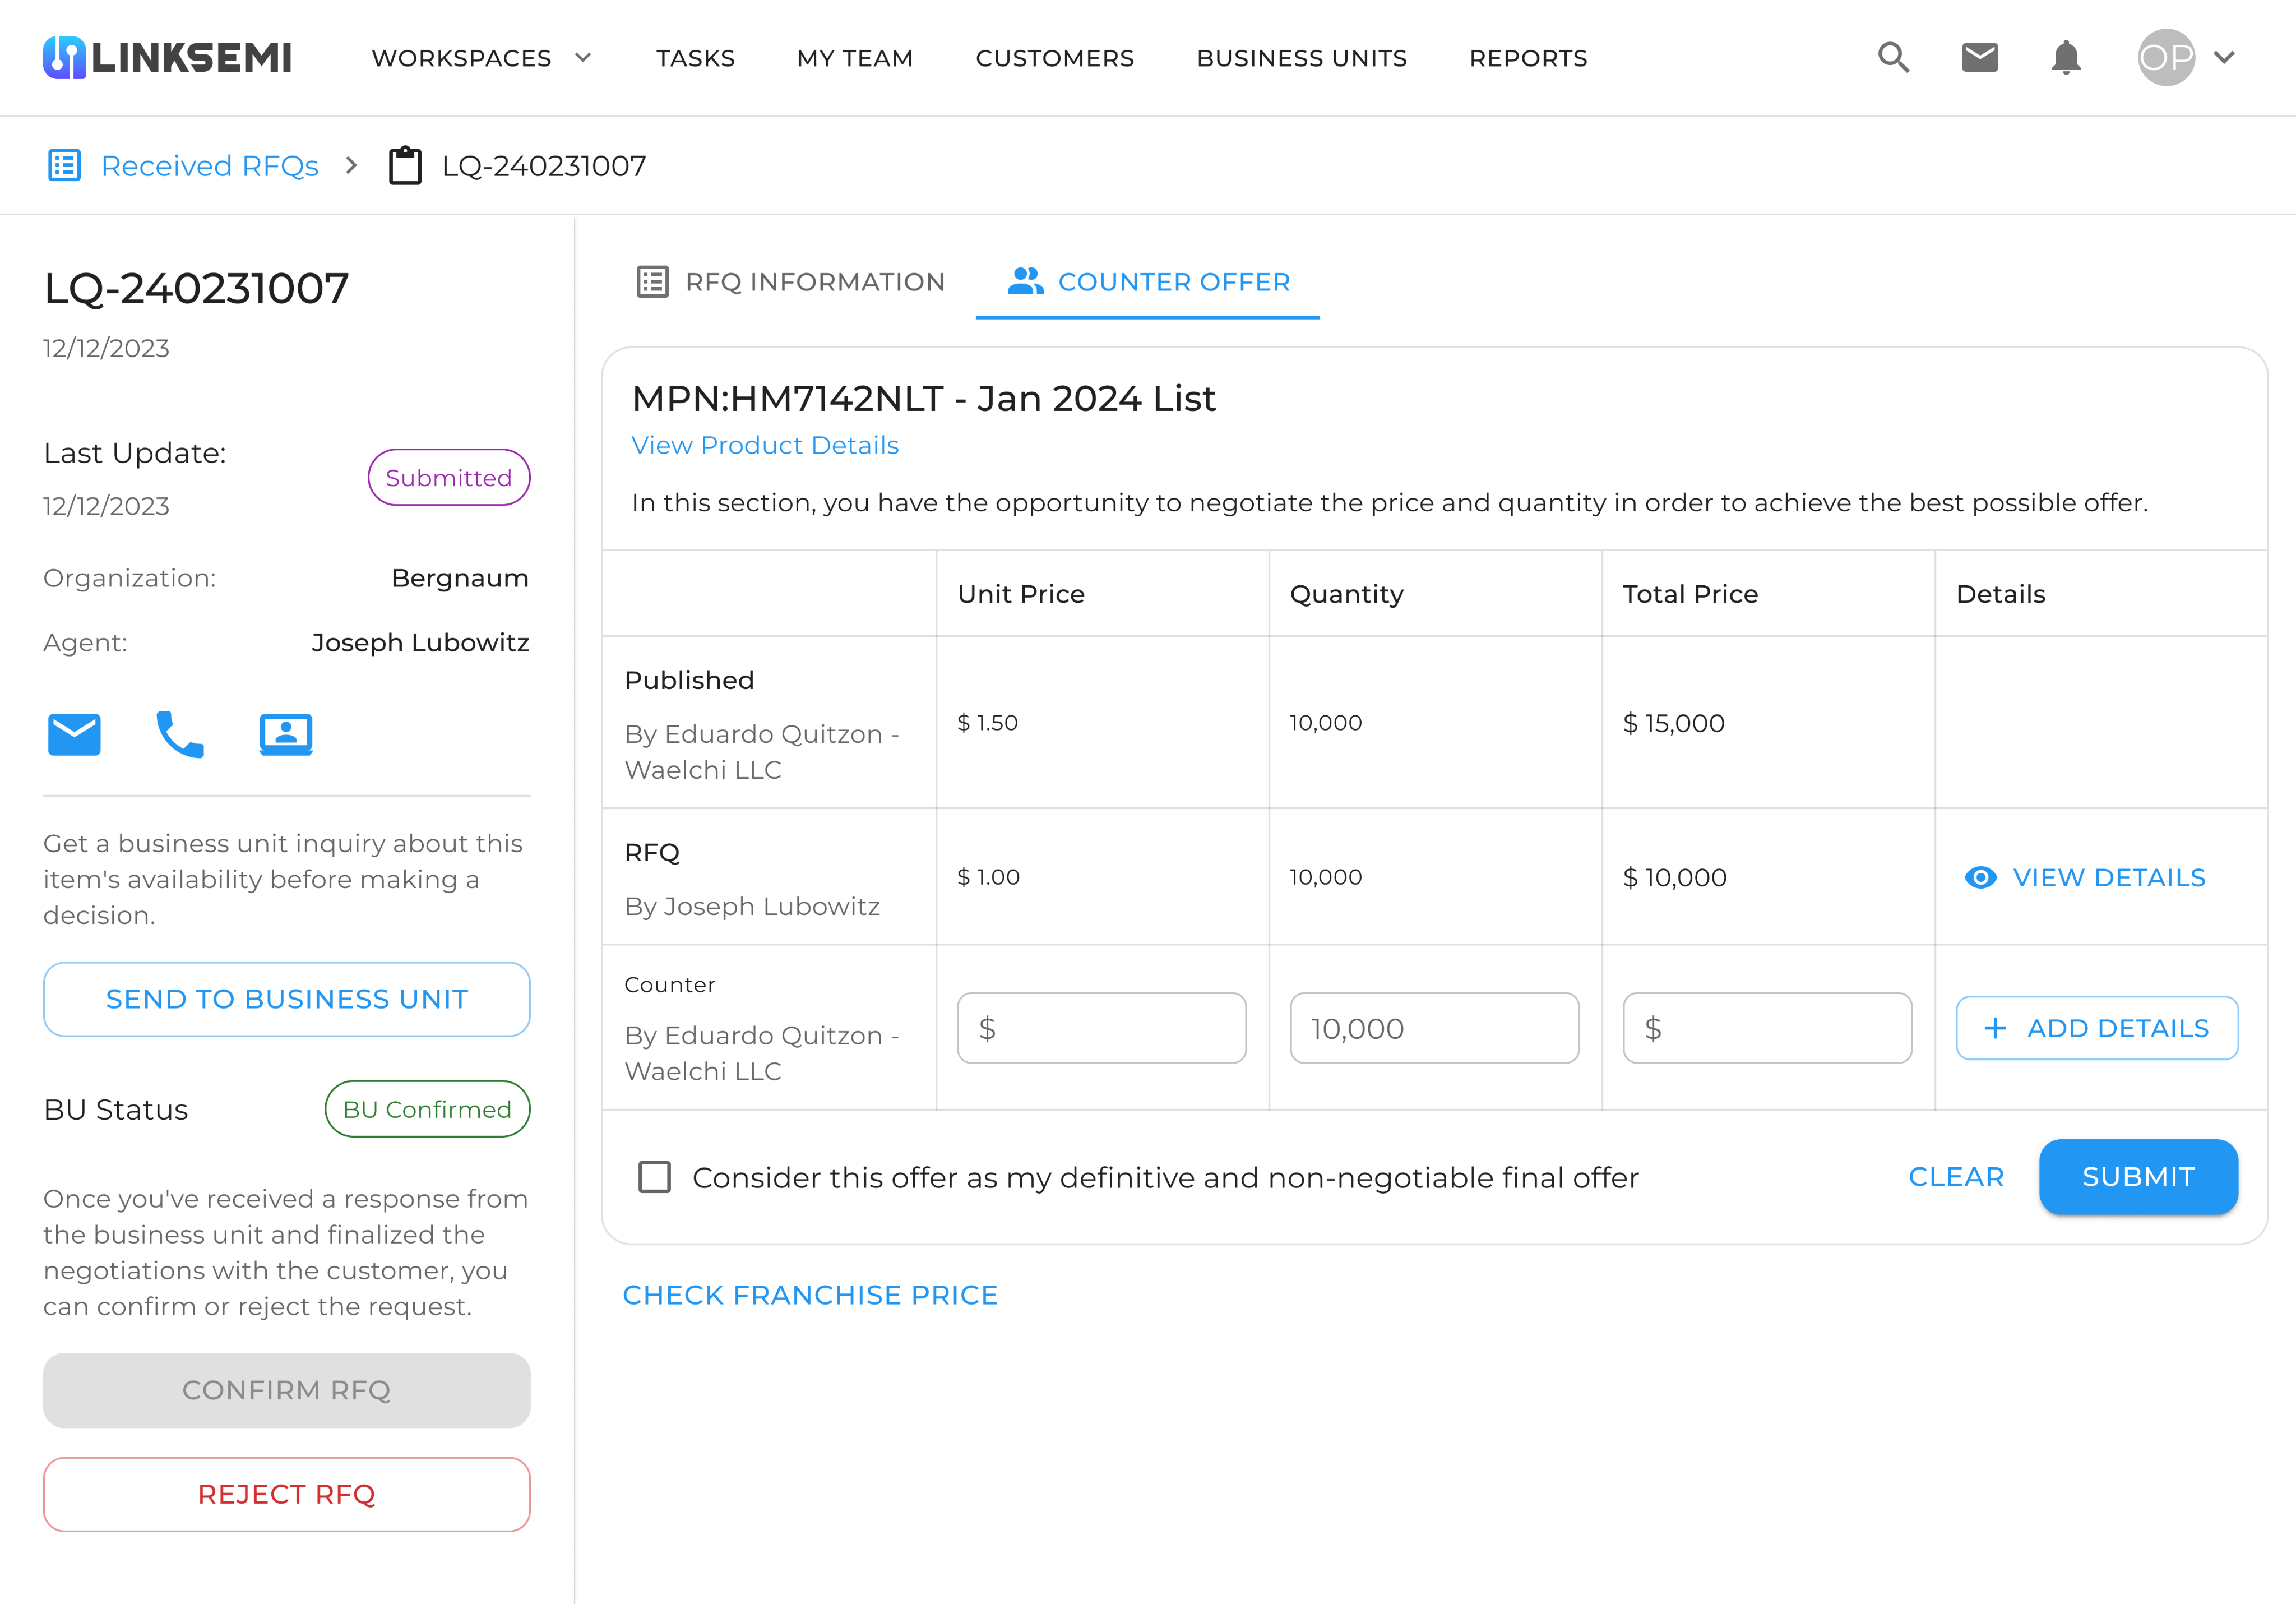
RFQ & Counter Offer
This page supports the process of Request for Quotation (RFQ) and negotiations. Users can review product details, proposed prices, and quantities, while also submitting counter offers. The system clearly indicates the RFQ status (e.g., Submitted, Confirmed, or Rejected), making the negotiation process transparent and efficient.
With this feature, users could:
- Upload component lists and instantly see which items were flagged as excess or obsolete.
- Analyze inventory risks through detailed lifecycle data, compliance checks, and pricing comparisons.
- Share the list with relevant partners or suppliers, creating opportunities to sell unused parts instead of writing them off.
- Recover value from otherwise stagnant inventory by connecting directly with companies that had active demand.
From a design perspective, the challenge was to present complex data (such as lifecycle status, risk levels, and compliance) in a way that was clear, visual, and actionable. The dashboard provided intuitive charts and indicators, enabling users to quickly spot at-risk items and make decisions about whether to sell, replace, or hold.
Ultimately, the E&O feature turned a common supply chain problem into a strategic opportunity, helping companies reduce waste, improve cash flow, and strengthen collaboration with industry peers.
Shortage
The Shortage feature was built to help companies quickly identify and resolve critical component shortages in their supply chain. In the semiconductor industry, shortages can disrupt production lines, delay projects, and cause significant financial loss. This feature was designed to give users real-time visibility into market availability and connect them directly with suppliers.
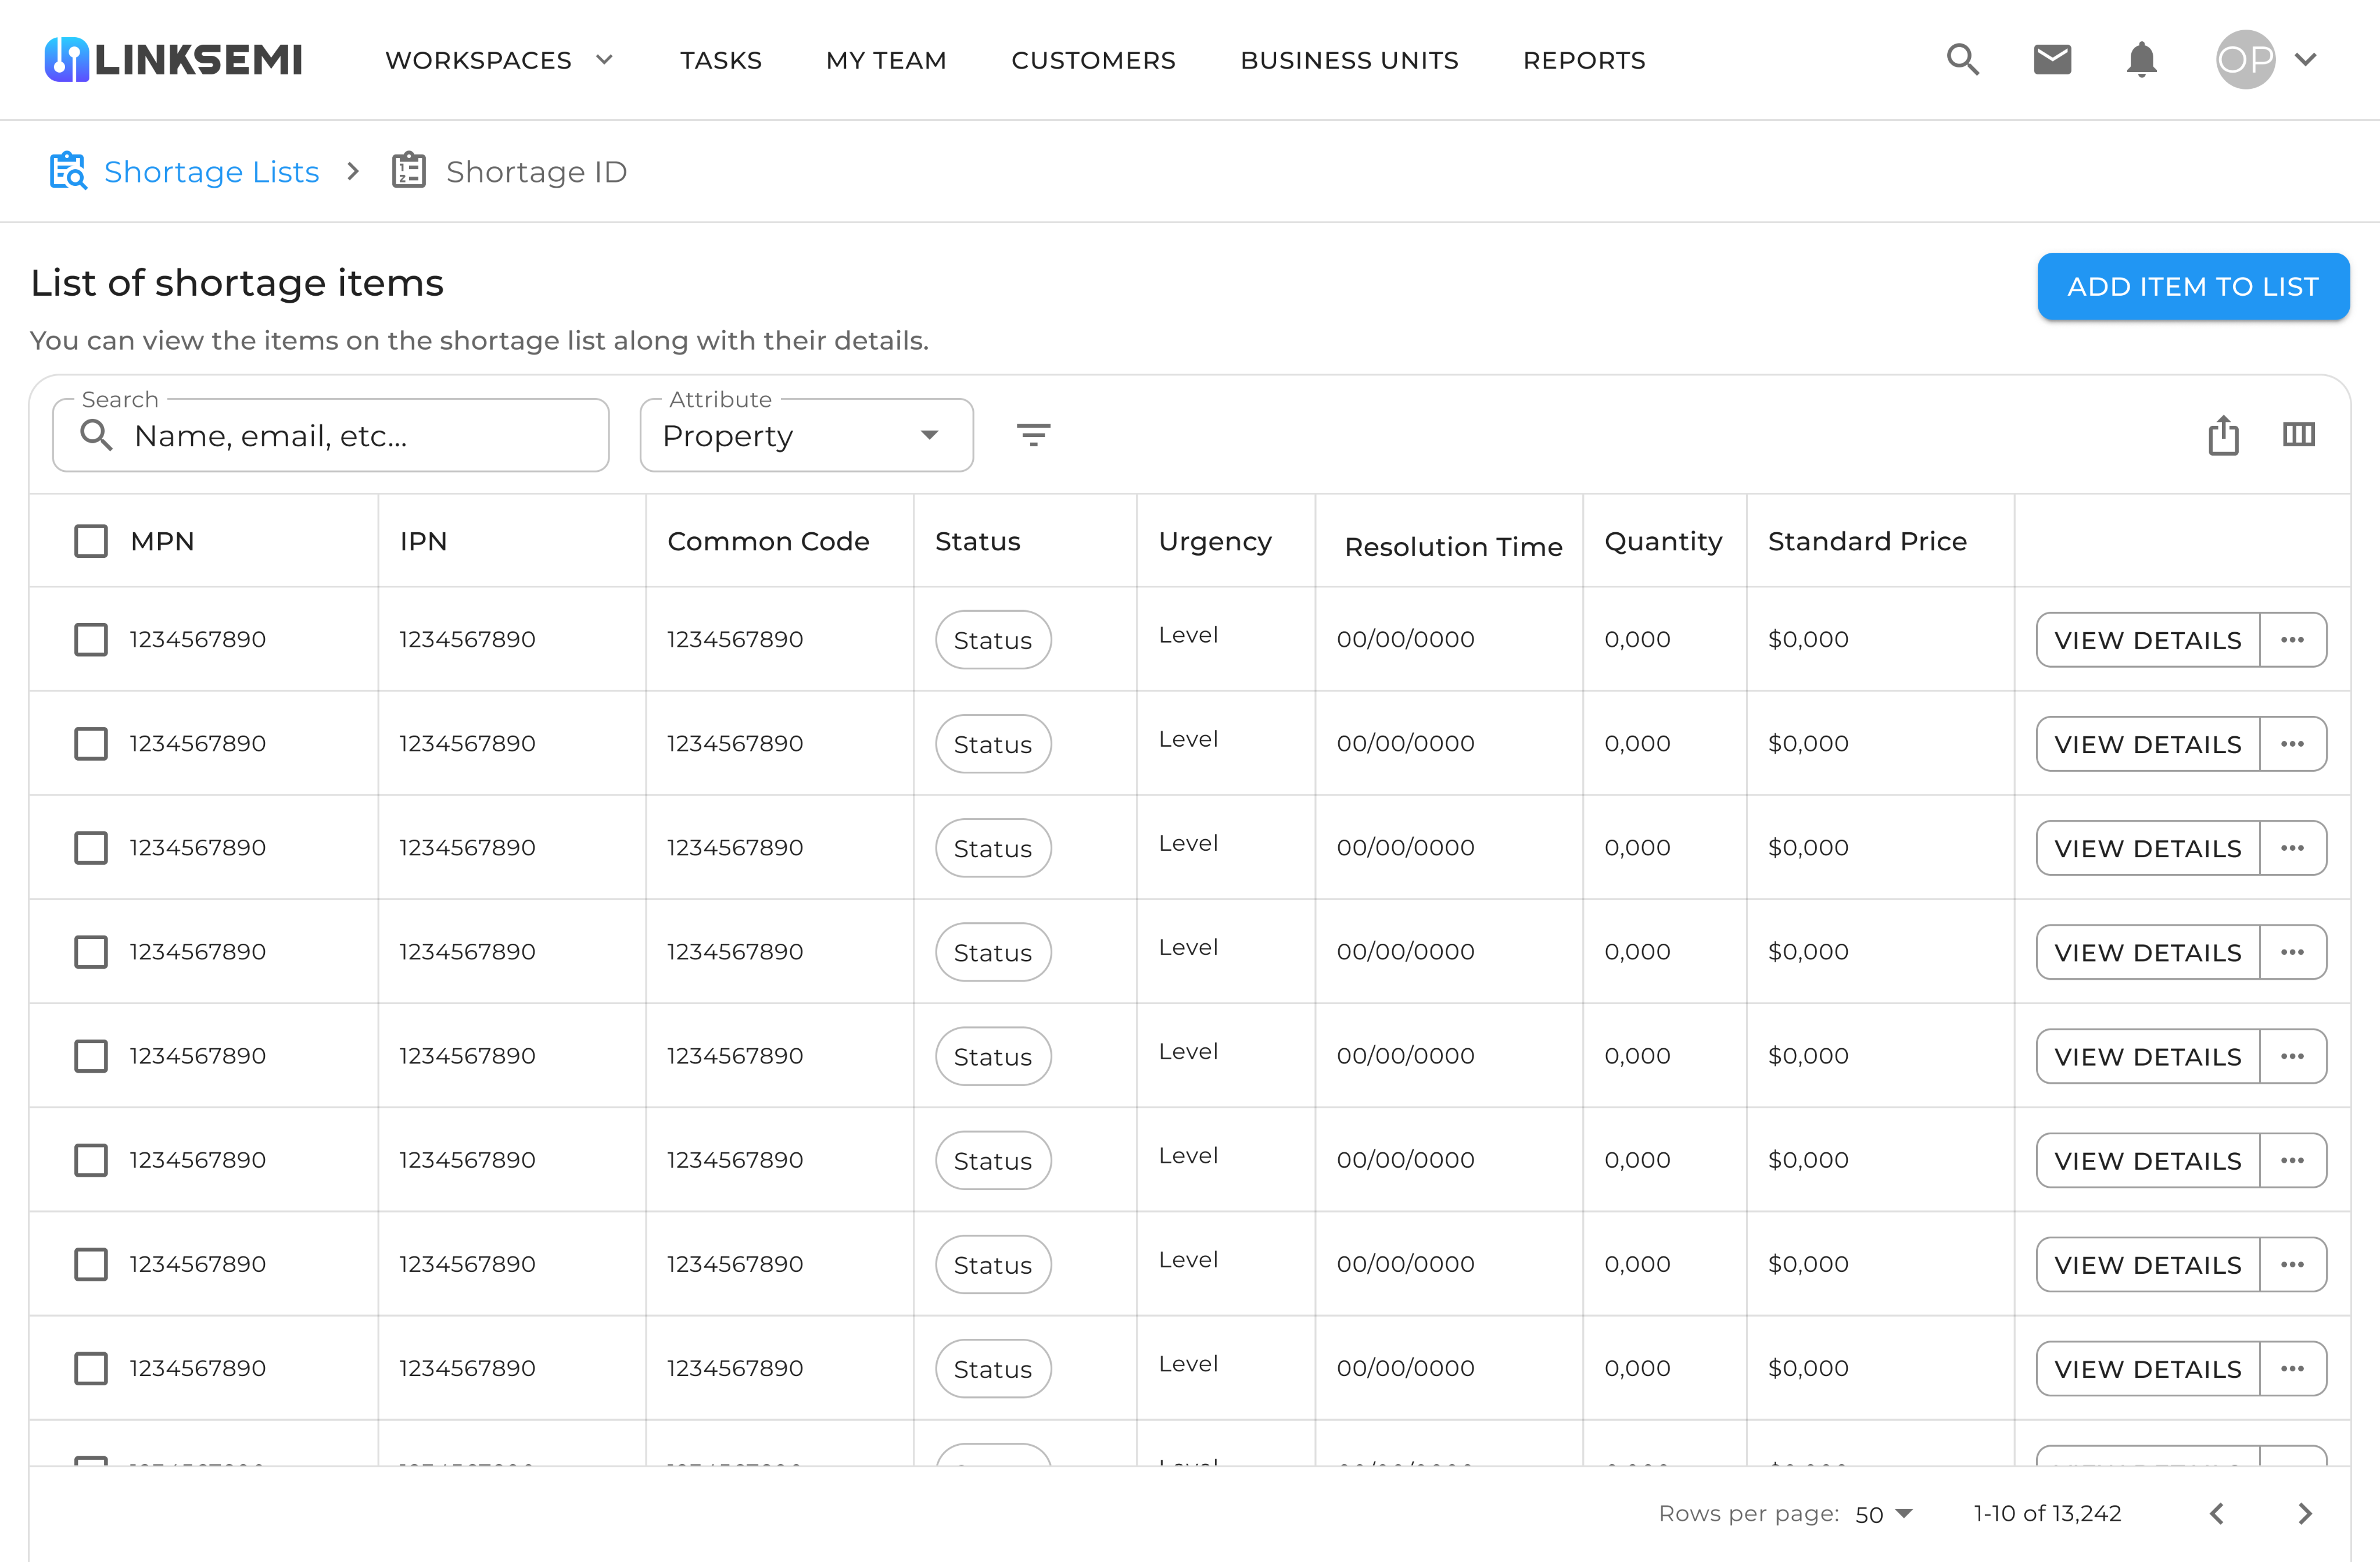
Shortage Items List
A tabular view of all shortage parts with key fields: MPN/IPN, Common Code, Status, Urgency, Resolution Time, Quantity, and Standard Price. Users can search, filter by attribute, switch view modes, and add items. Row actions (e.g., View Details) let teams drill into a part and kick off RFQs.
Customers (Share & Permissions)
The directory for selecting which customers/suppliers can see a shortage list and participate in deals. Each record shows organization, rep details, and deal permission. Users can add or edit contacts so shortage requests reach the right partners quickly.

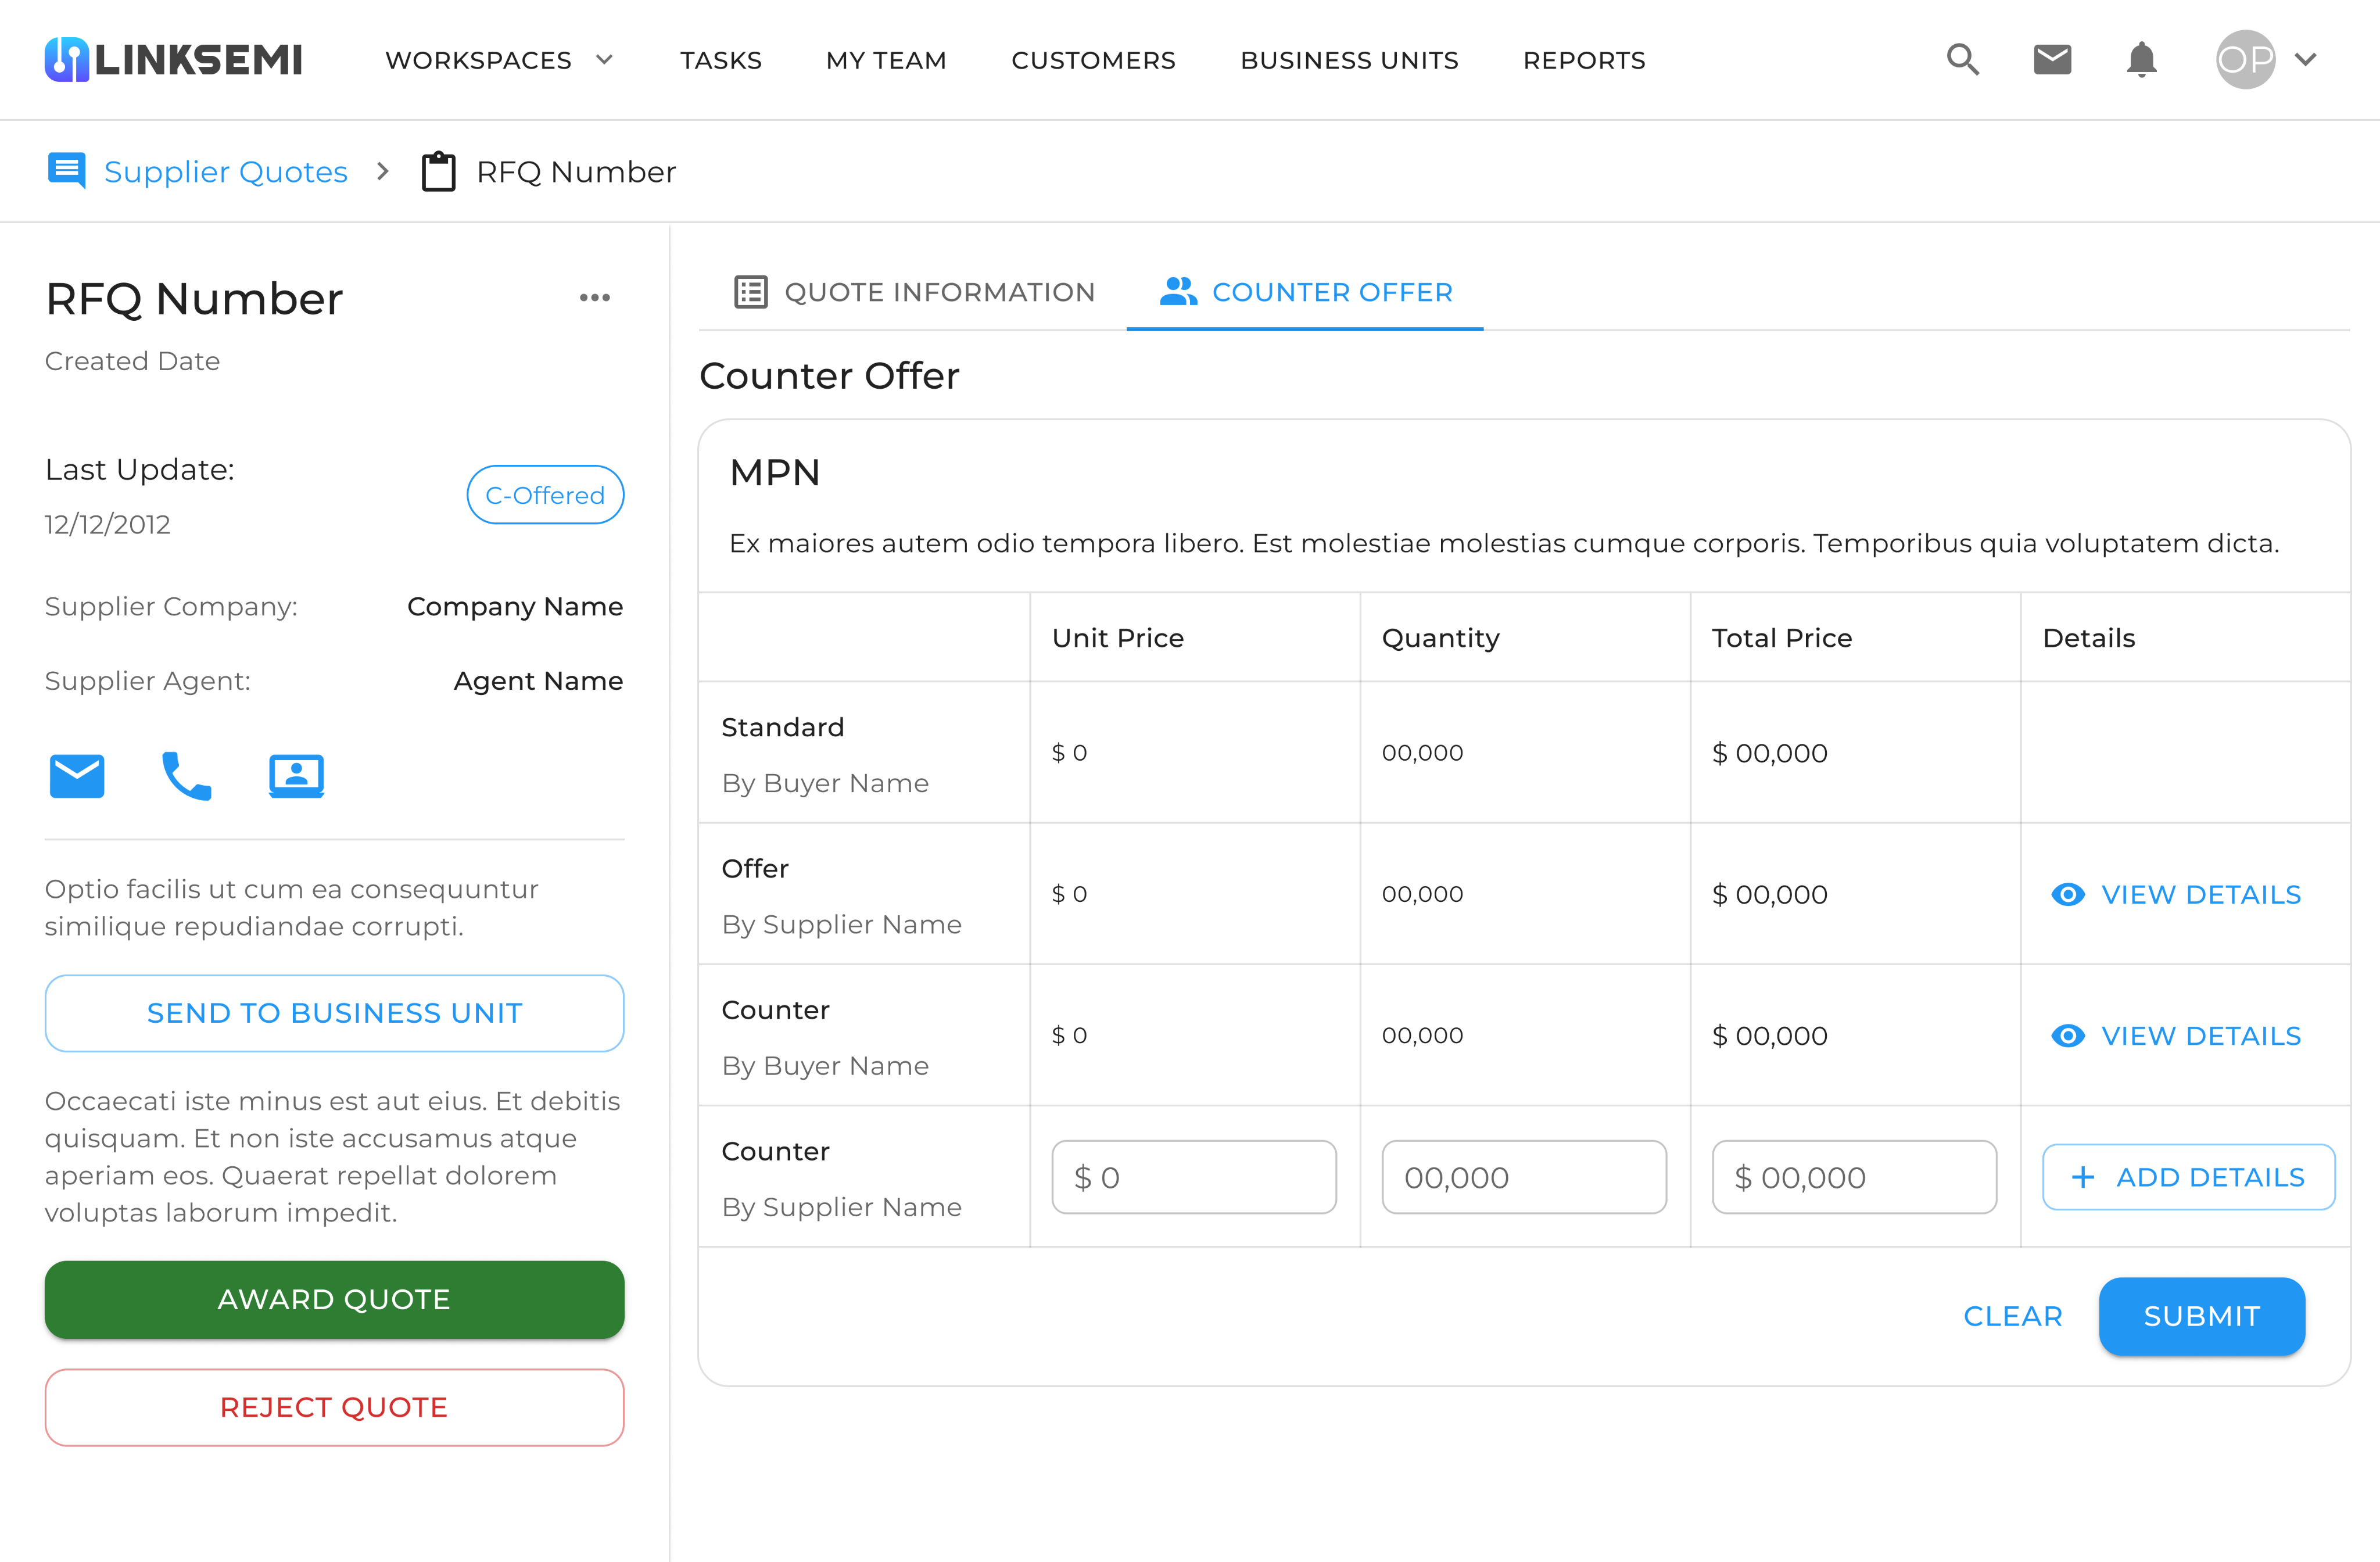
Supplier Quote & Counter Offer
The negotiation workspace for a specific shortage RFQ. It surfaces the buyer’s standard/target entry, the supplier’s offer, and iterative counter-offers (price & quantity). Side actions enable routing to a Business Unit, then award or reject the quote—making the fulfillment loop fast and transparent.
With this feature, users could:
- Upload shortage lists and see which components were in limited supply.
- Analyze availability trends through metrics like total stock, median price, estimated days of supply, and historical procurability.
- Forecast risks by tracking how availability changes over time with trend charts.
- Request quotations (RFQs) directly from suppliers and negotiate through the platform, speeding up procurement.
- Collaborate with business units or external partners to secure critical parts before competitors.
From a design perspective, the challenge was to visualize scarcity in a clear and urgent way, while still giving users the tools to act on the information. By combining data dashboards with actionable workflows (like RFQ requests and counter-offers), the Shortage feature transformed a potential bottleneck into an opportunity for proactive supply chain management.
PPV+ (Purchase Price Variance)
The PPV+ feature was designed to give companies a transparent view of how their purchase prices compared to market benchmarks. In the semiconductor industry, even small variances in unit price can lead to significant cost differences across high-volume orders, so this feature was critical for procurement optimization.
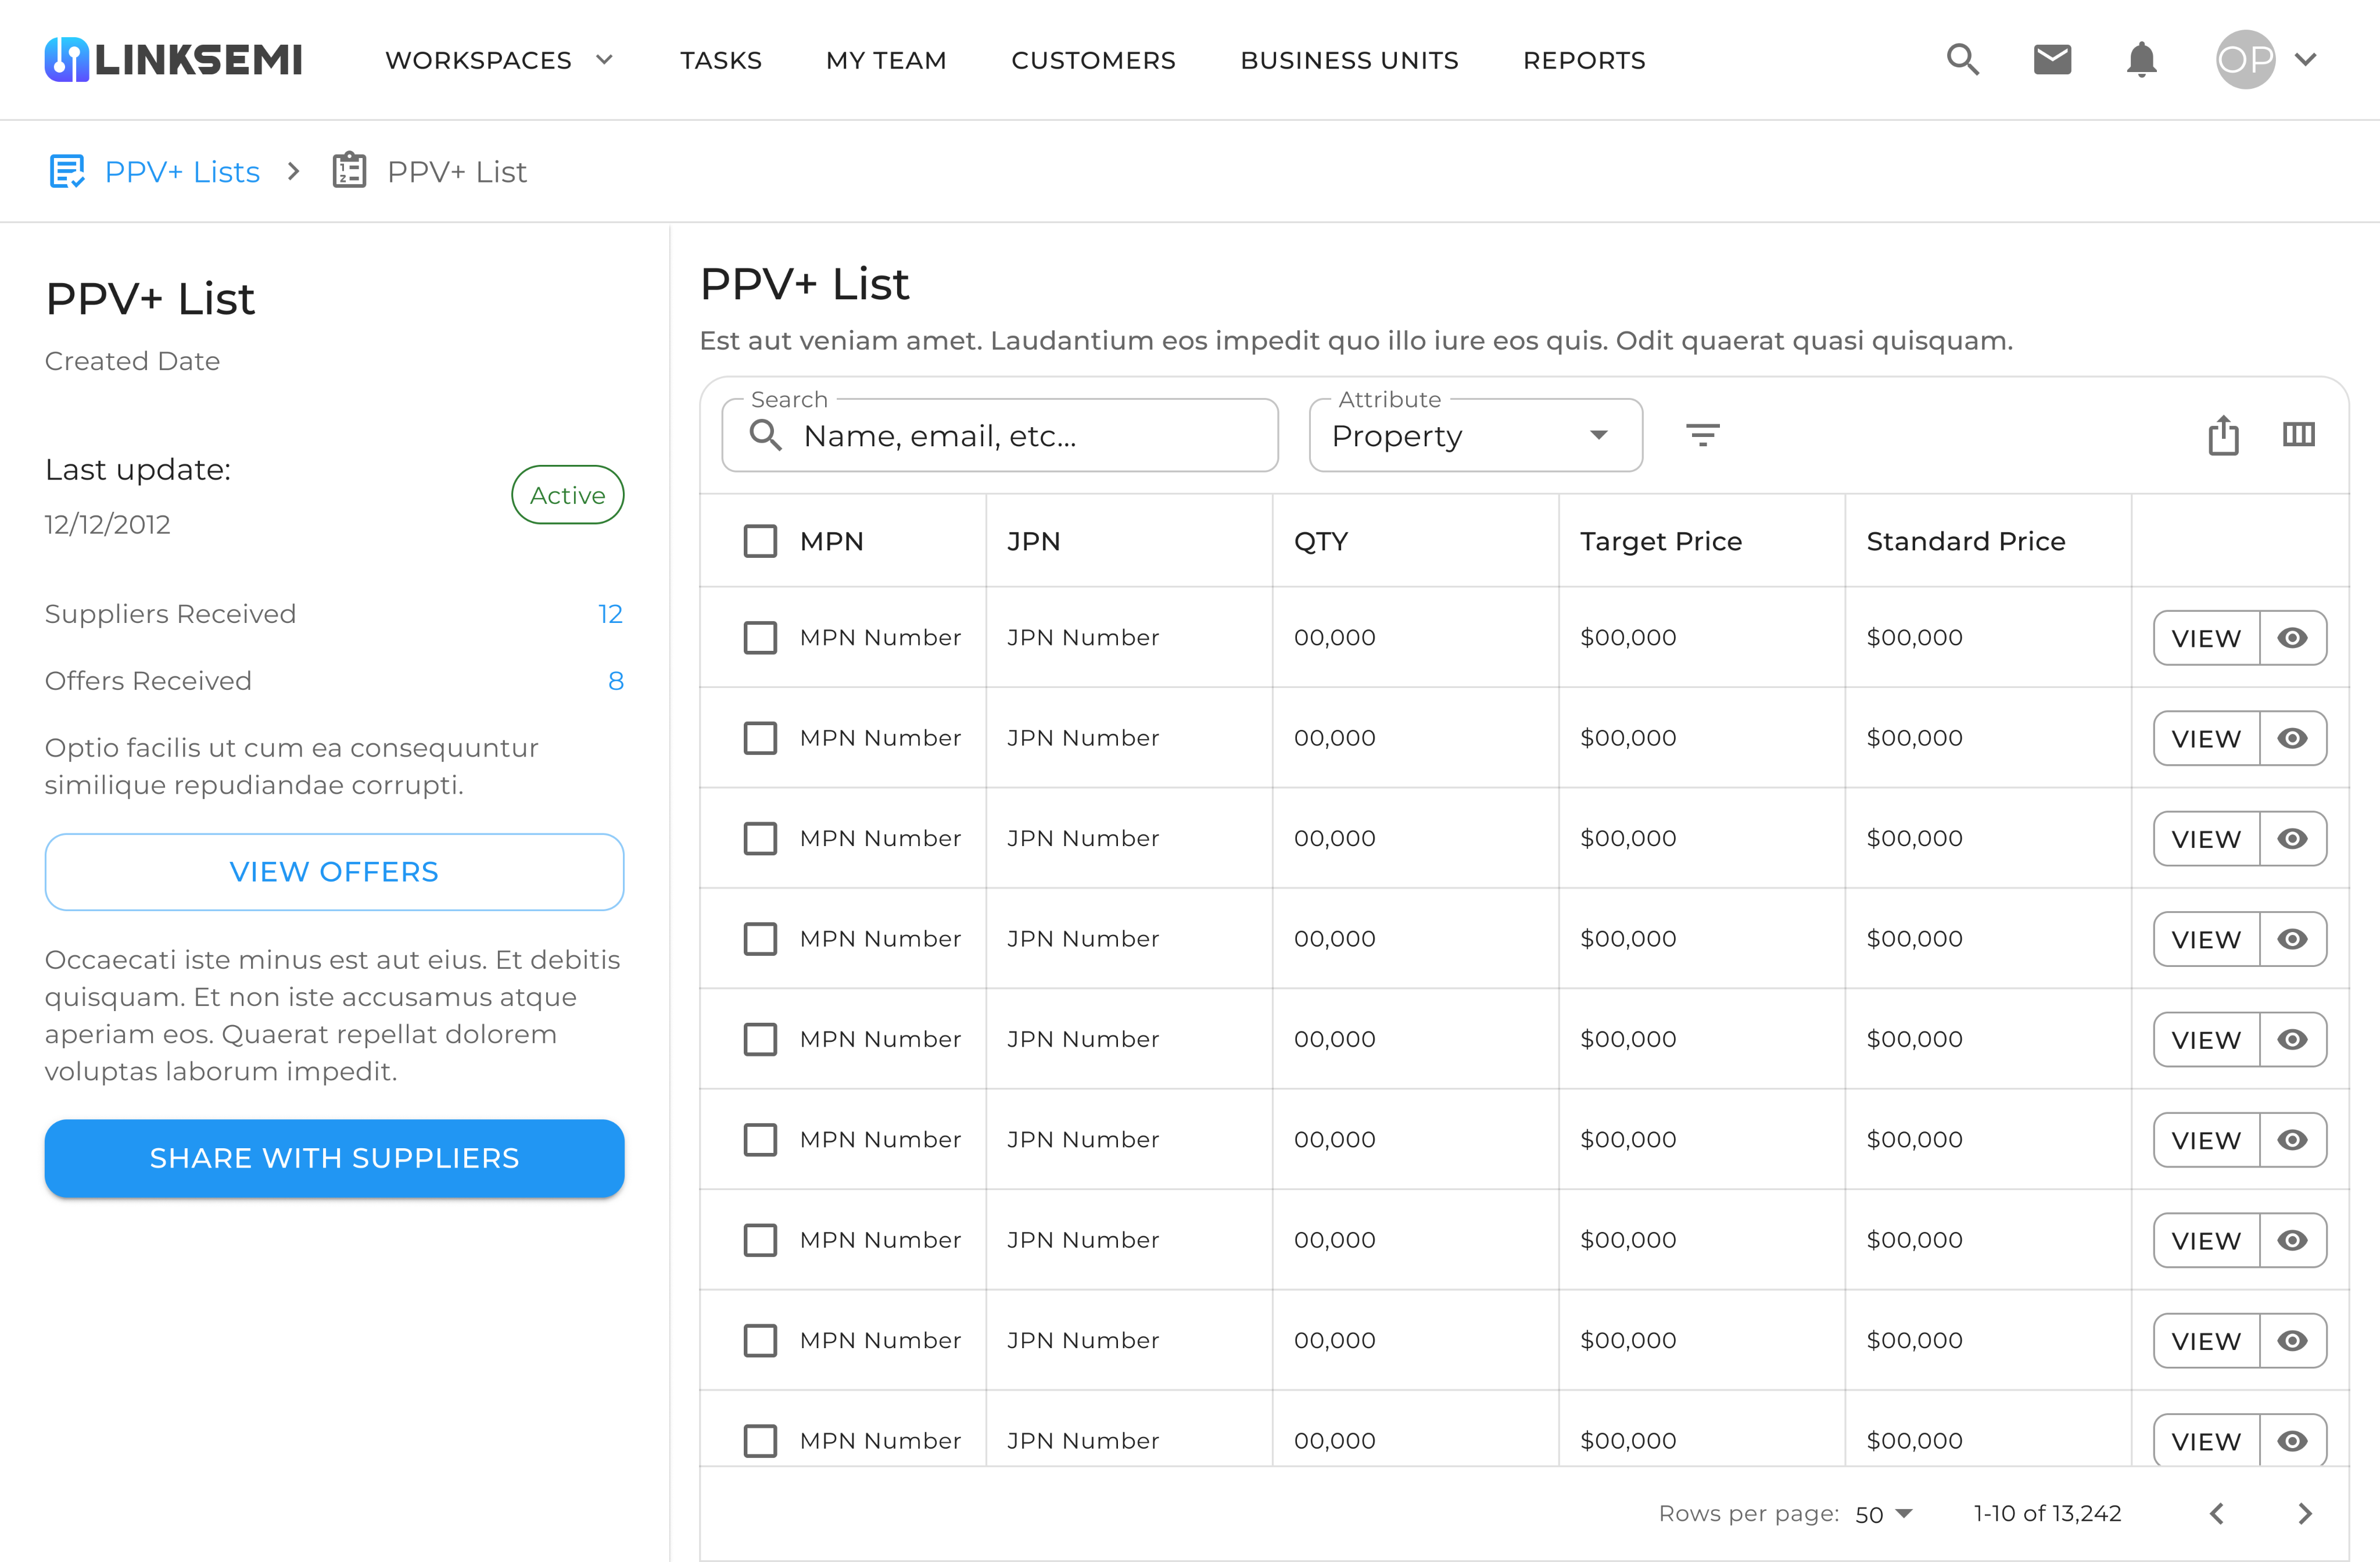
PPV+ List
This page displays the PPV+ (Purchase Price Variance) list, where users can upload component data and compare their target prices with standard market prices. It provides transparency in procurement, helping buyers identify cost-saving opportunities and negotiate better deals with suppliers.
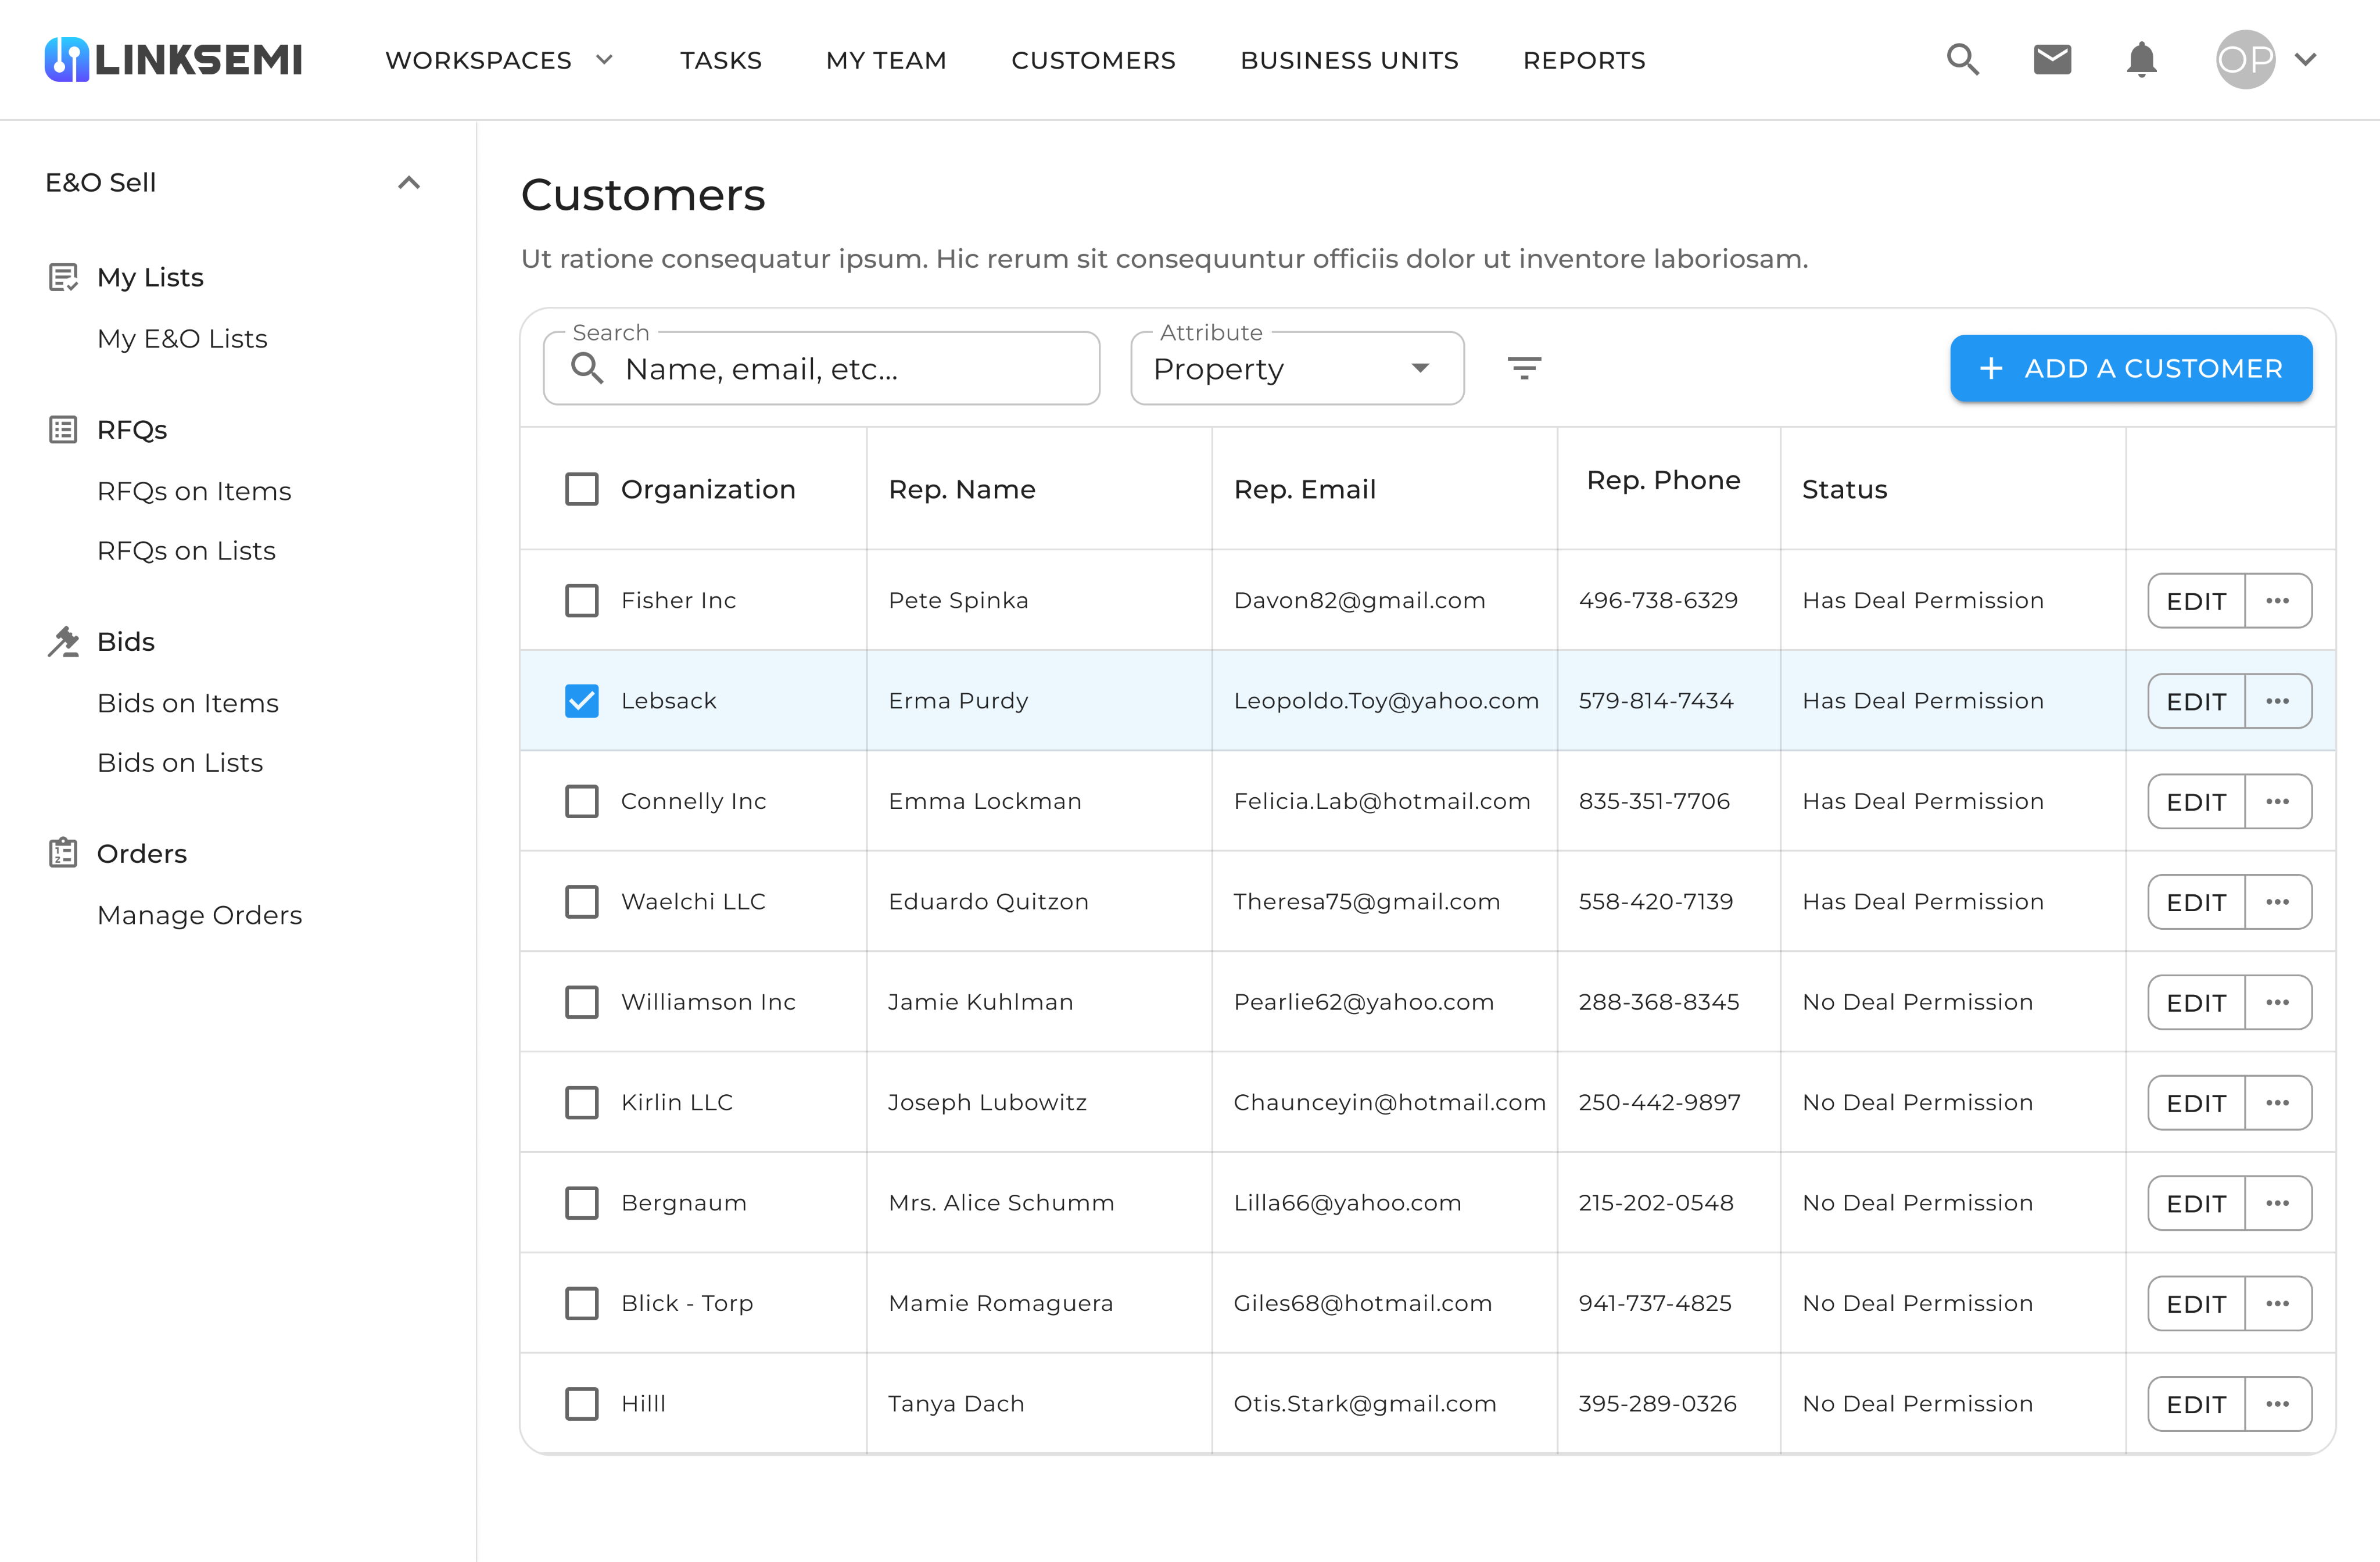
Customers Management (within PPV+)
This section allows users to manage their customer relationships in the context of PPV+. Each record shows the organization, representative details, and deal permissions. Users can add new customers or edit existing ones, ensuring that only authorized contacts can participate in bidding and negotiations.
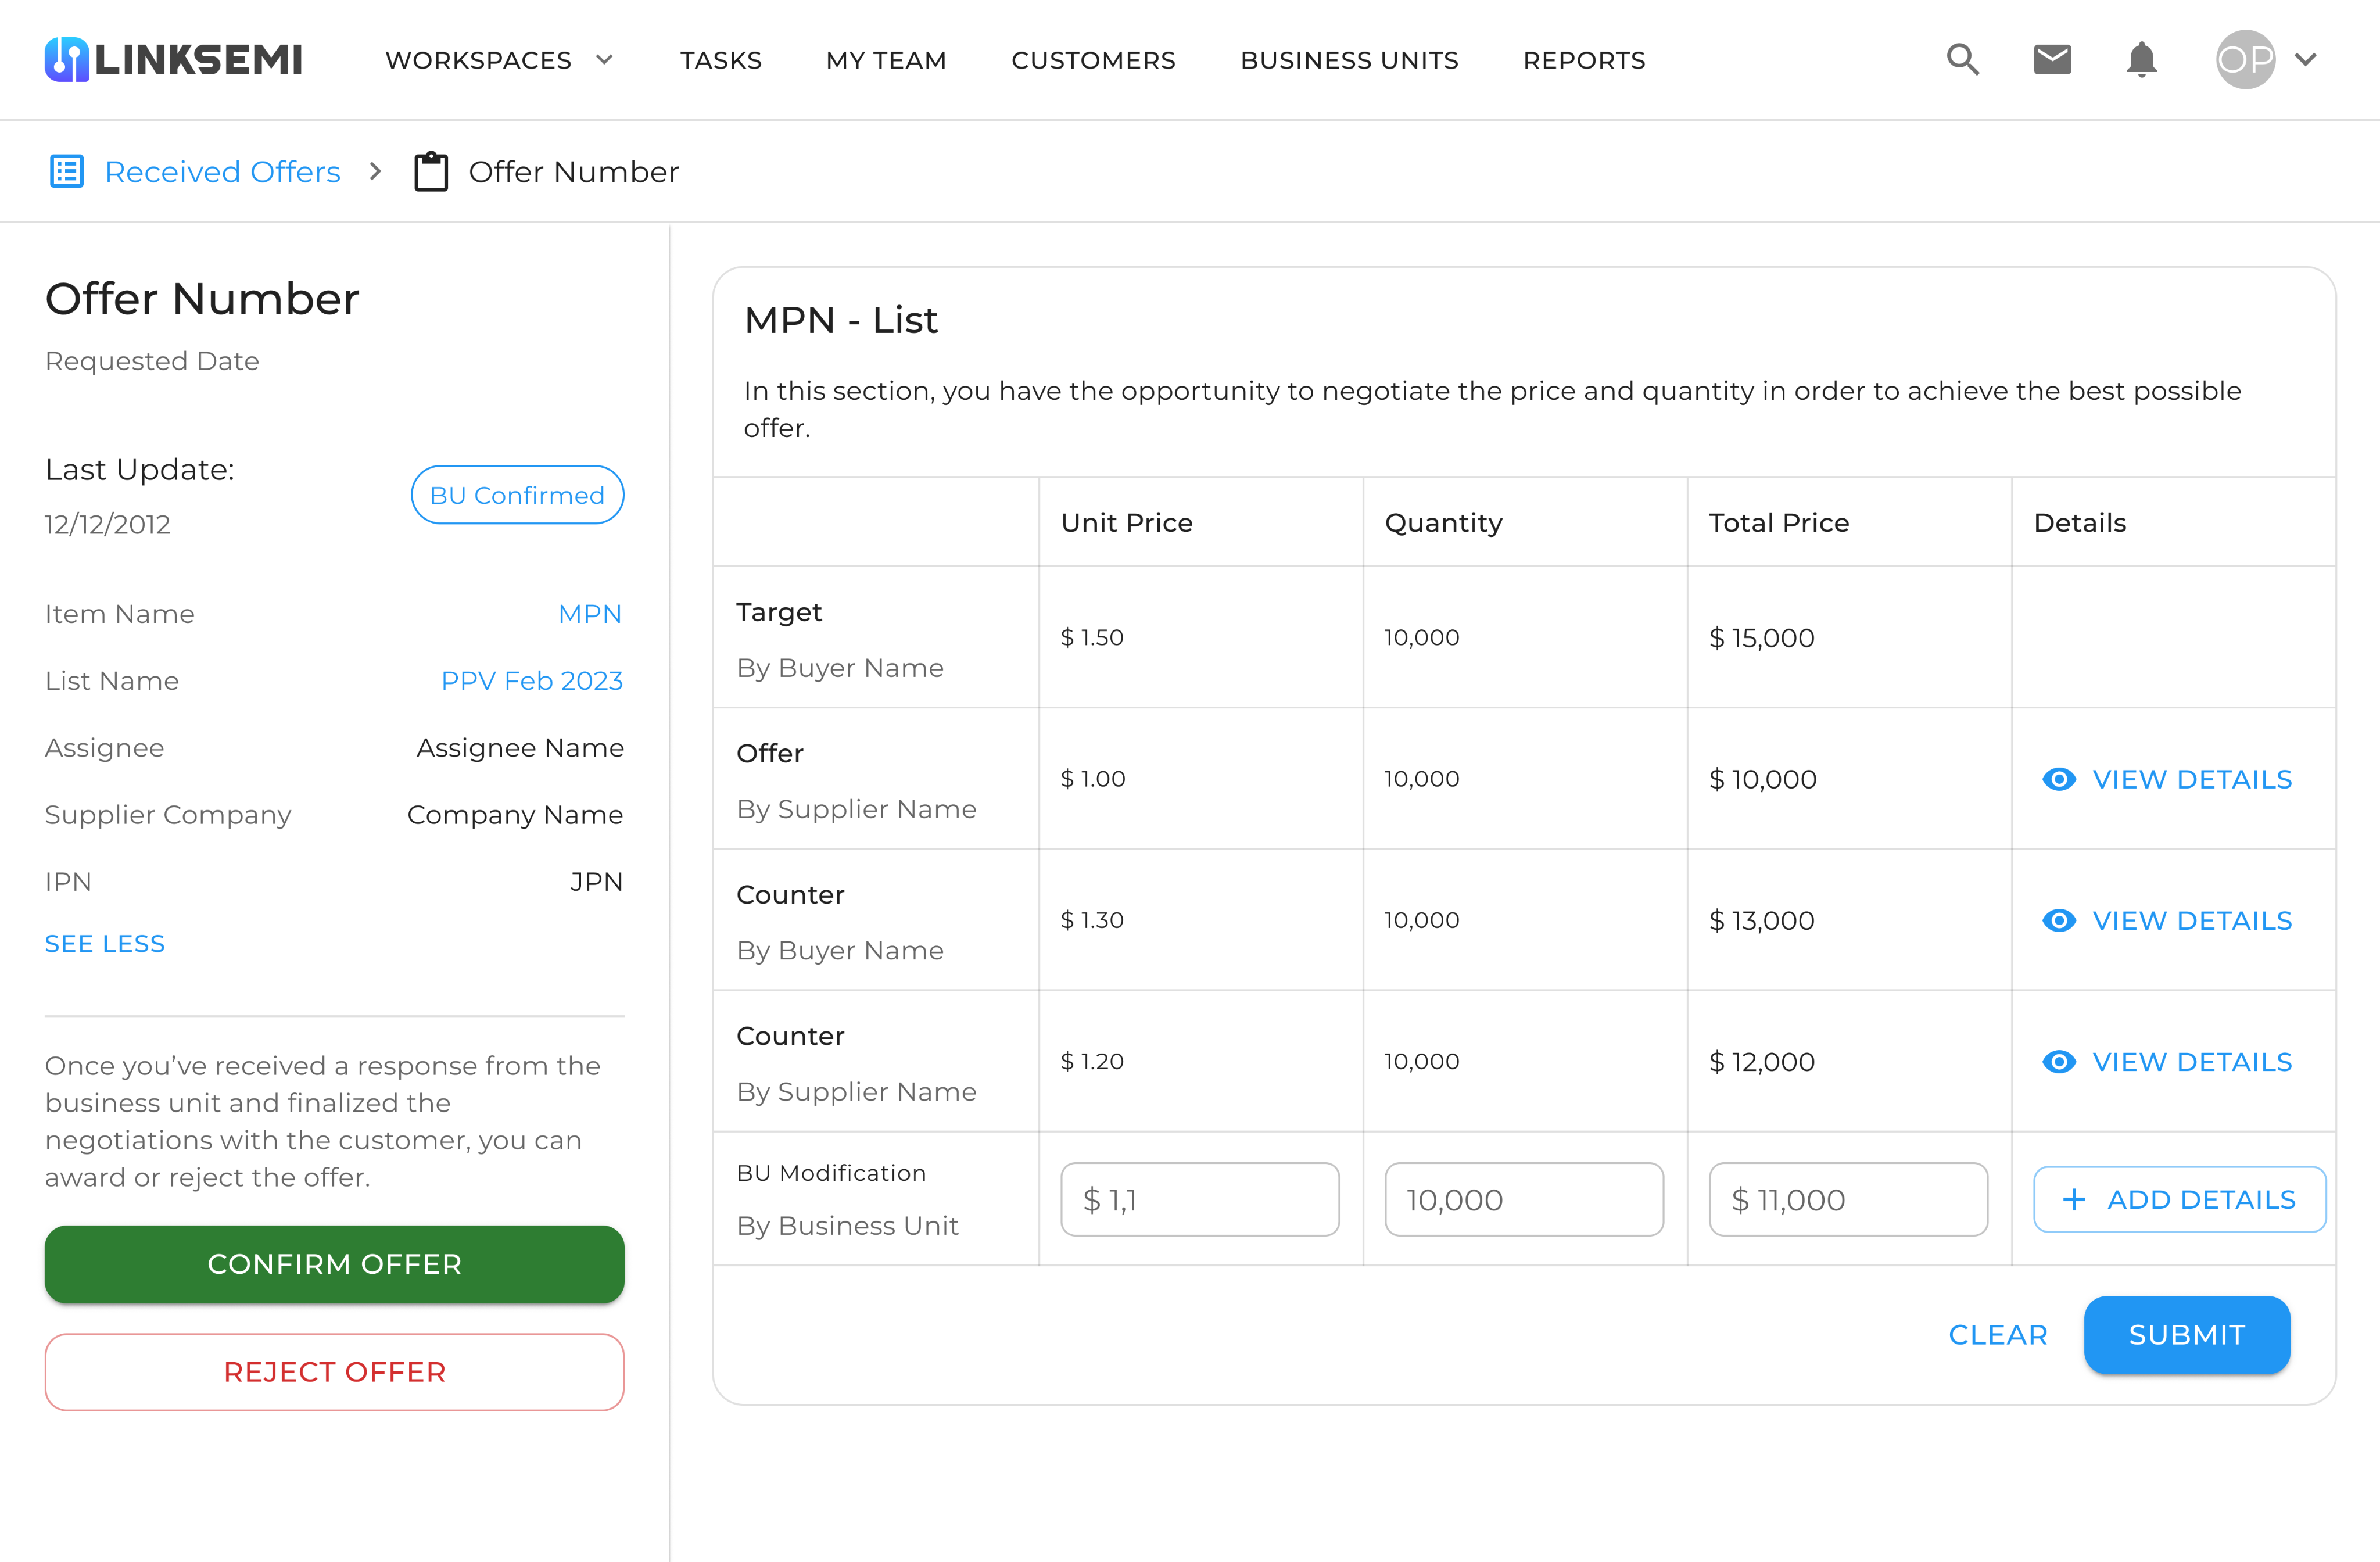
Offer & Negotiation Page
This page supports the negotiation workflow for PPV+. It presents the target price from the buyer, the supplier’s offer, and multiple counteroffers. Users can adjust price and quantity until both sides reach an agreement. The clear step-by-step interface makes the process of confirming or rejecting offers efficient and transparent.
With PPV+, users could:
- Upload lists of components with their target or internal purchase prices.
- Compare against real-time market prices, highlighting cost gaps and opportunities for savings.
- View offers from multiple suppliers in one place and track how many responses each list received.
- Negotiate directly within the system, using counter-offers to arrive at a mutually beneficial deal.
- Share PPV+ lists with trusted suppliers, ensuring only authorized partners had access to sensitive pricing data.
From a design perspective, the challenge was balancing complex procurement data (target vs. standard prices, supplier offers, counteroffers) with a clean and navigable interface. Tables were structured to make large datasets scannable, and negotiation screens were simplified into step-by-step flows so users could quickly decide whether to accept, reject, or counter an offer.
Ultimately, PPV+ empowered procurement teams to reduce costs, gain pricing leverage, and strengthen supplier negotiations—all while working in a centralized, transparent environment.
AI Assistant
The AI Assistant was introduced as an intelligent layer on top of the platform to help users interact with their data conversationally instead of navigating through multiple dashboards. Its purpose was to simplify complex workflows and provide instant answers to common business questions.


AI ASSISTANT
Mobile AI Assistant
On mobile, the AI Assistant delivers daily highlights at a glance. Users can see active and expired lists, new RFQs, bids, and pending confirmations. It also provides direct recommendations, such as awarding an order or confirming a bid. This design makes it easy for users to stay on top of critical tasks while on the go, without needing to navigate through multiple dashboards.
Desktop AI Assistant
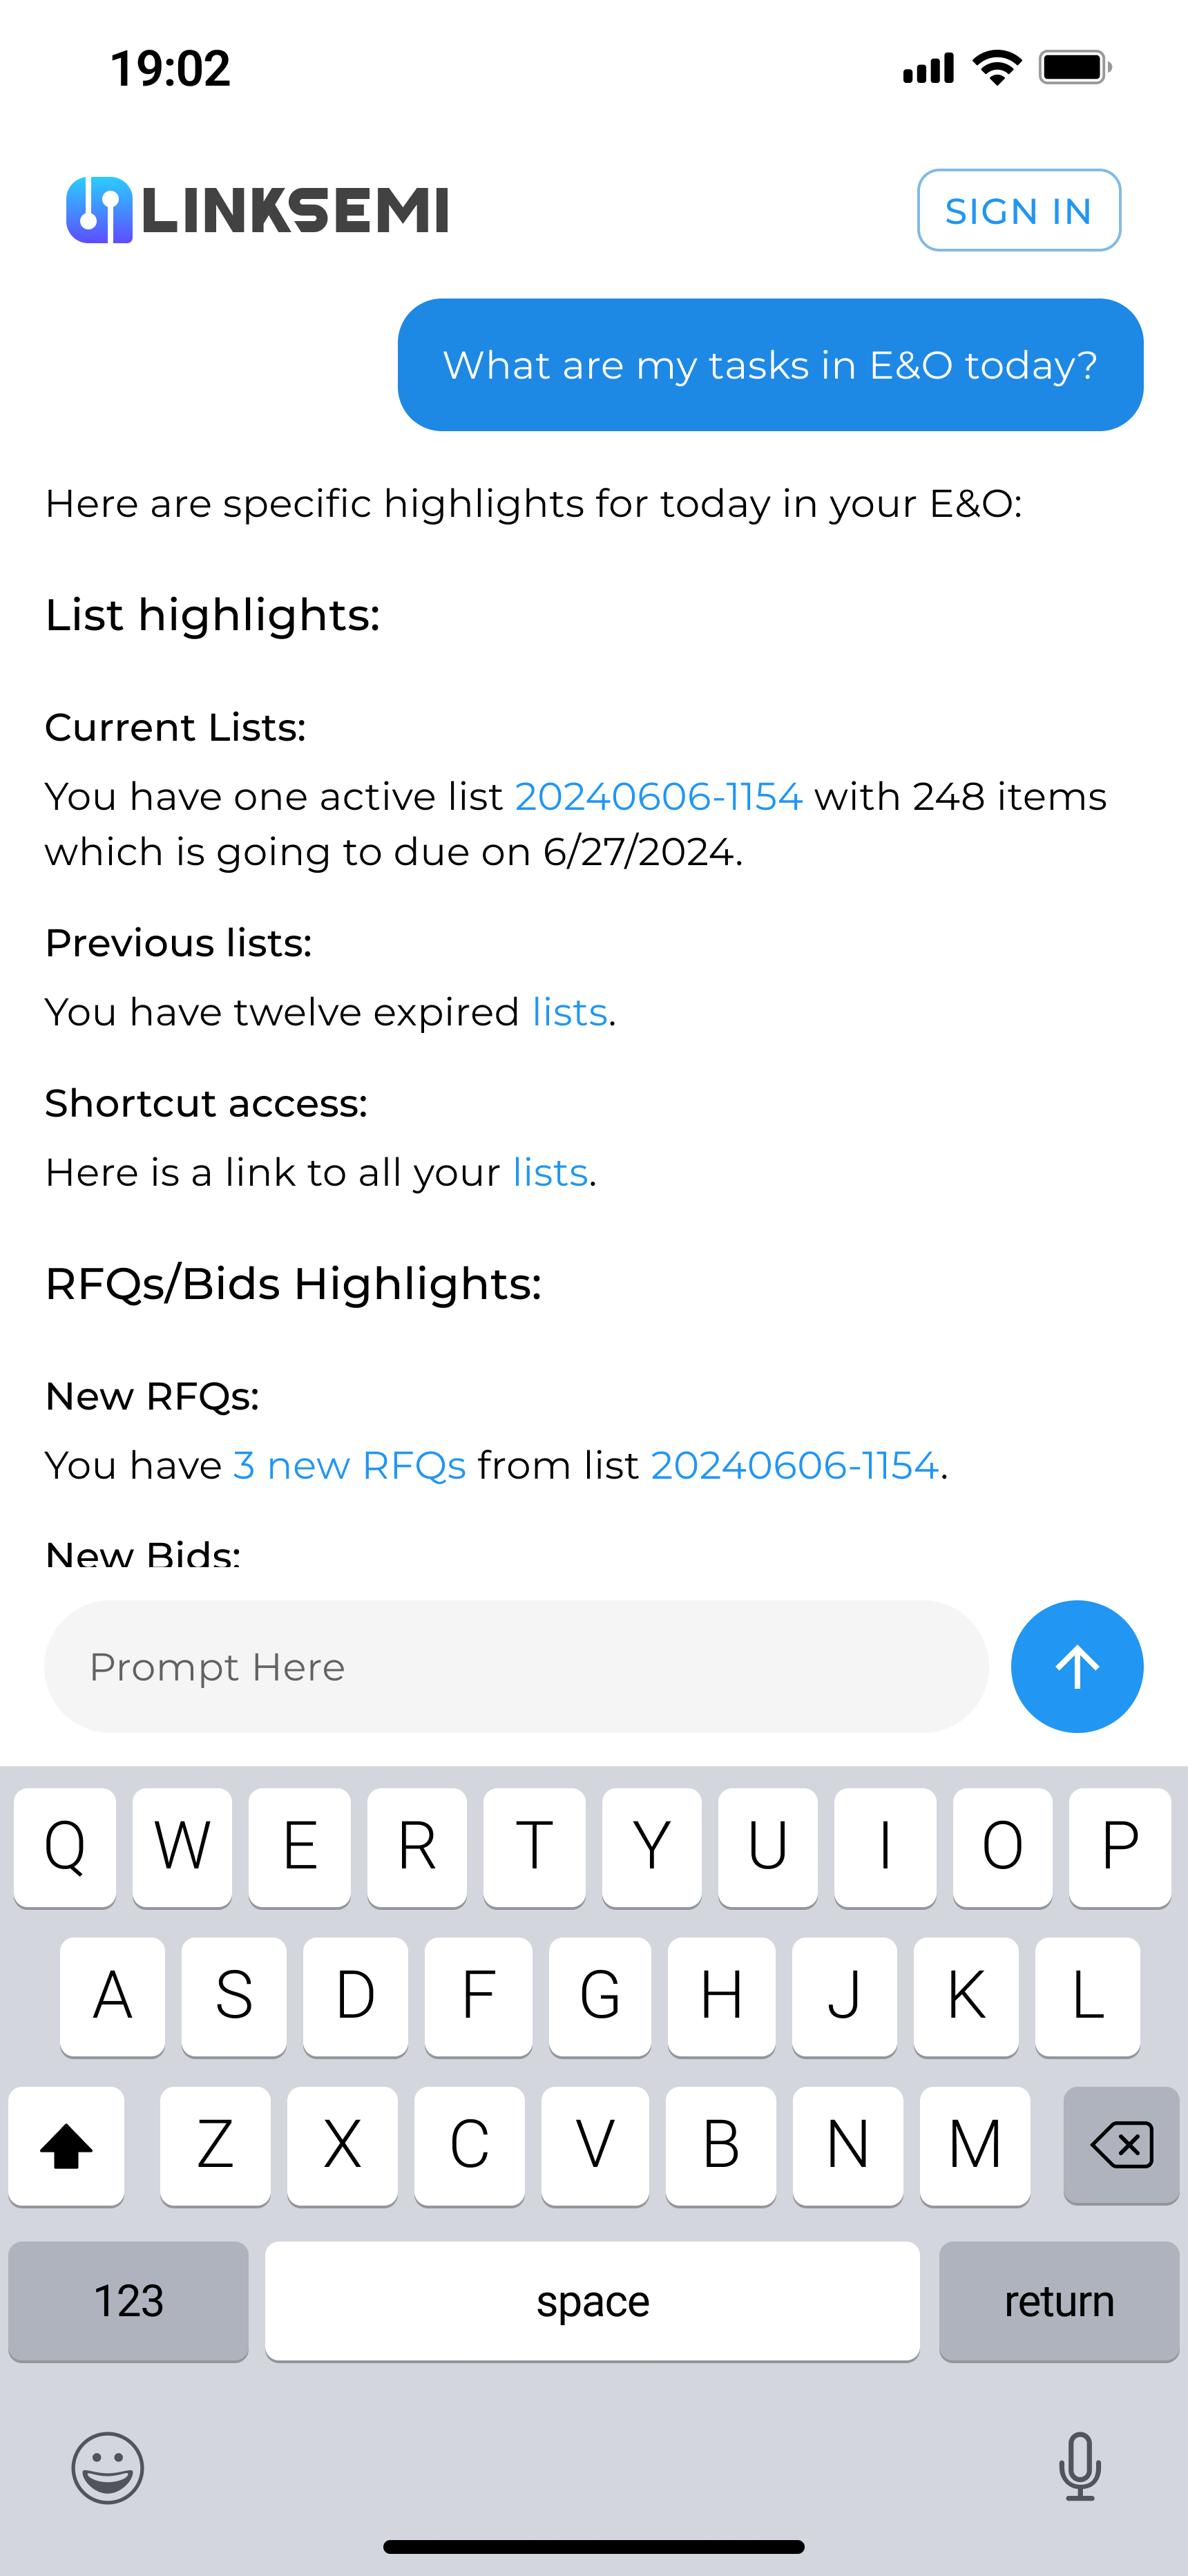
On desktop, the AI Assistant acts as a central conversational hub. Users can type or speak natural language questions and instantly access insights across E&O, Shortage, and PPV+. Quick-action buttons and suggested prompts guide users to common tasks, turning complex workflows into simple conversations. This creates a more human-centered experience for managing supply chain data.
With the AI Assistant, users could:
- Ask questions in natural language, such as “What are my tasks in E&O today?” or “Can you summarize my recent activities in PPV+?”.
- Get daily highlights: active or expired lists, new RFQs, pending bids, and recommendations for orders or confirmations.
- Access shortcut insights directly (e.g., open specific lists or see which RFQs are waiting for business unit approval).
- Navigate across features (E&O, Shortage, PPV+) through quick-action buttons instead of manual searching.
- Use it seamlessly on both web and mobile, making insights available anywhere.
From a design perspective, the challenge was to balance simplicity with depth: the interface had to feel as easy as chatting with a colleague while still giving access to highly detailed supply chain data. By surfacing personalized highlights, proactive recommendations, and shortcuts, the AI Assistant reduced cognitive load and turned a complex B2B platform into a human-centered experience.
Conclusion
Designing for Linksemi was a unique opportunity to work on a B2B SaaS platform in the semiconductor industry, where I focused on turning highly complex data and workflows into clear, intuitive, and user-friendly experiences. Over the course of 1 year and 9 months, I collaborated closely with the product team to define and design multiple product features, ensuring usability and scalability for a data-heavy platform.
Although the product delivered strong value for semiconductor companies by improving transparency and decision-making, the startup faced challenges beyond product development. Due to difficulties in attracting investment, Linksemi ceased operations in December 2024.
Despite this outcome, the experience gave me invaluable lessons in designing for complex B2B systems, aligning business needs with user goals, and building digital products in a highly technical and competitive space.
Contact
I’m always excited to connect and explore new ideas.Let’s create something meaningful together.


© 2025 Sam Miri. All rights reserved.


Project & Company Introduction
Linksemi was a B2B SaaS startup in the semiconductor industry, offering a peer-to-peer federated knowledge-sharing platform. Its core mission was to mitigate supply chain risks by providing real-time market information, predicting fluctuations, and smoothing them out with the help of AI-powered and federated ML tools.
The platform allowed semiconductor companies to register, upload their component lists, and gain full visibility into the market. By participating anonymously, stakeholders could share insights, exchange components, and collaborate without exposing sensitive data. Automated workflows further streamlined communication between manufacturers, suppliers, and buyers, addressing the long-standing gaps of transparency and visibility in this space.
The product revolved around three key features:
- E&O (Excess & Obsolete) – for identifying surplus or outdated parts.
- Shortage – for detecting and solving critical component scarcities.
- PPV+ (Purchase Price Variance) – for analyzing and optimizing purchase prices across the market.
Together, these features empowered companies to upload, share, and negotiate on component lists — creating a more efficient, data-driven ecosystem for the semiconductor supply chain.
My Role in the Project
I joined Linksemi as the Product Designer and worked closely with the Product Manager throughout the entire product lifecycle. My responsibilities covered both the strategic definition of features and the hands-on design work.
Key areas of my contribution included:
- Feature Definition: Collaborated with the Product Manager to translate business needs into well-defined product features and user flows.
- User Experience & Interface Design: Designed end-to-end user journeys for the three core features (E&O, Shortage, and PPV+), ensuring usability for B2B stakeholders handling complex data sets.
- UI System & Visual Design: Built consistent interface patterns and a design system to scale the dashboard experience across different features.
- Marketing Design: Created visual assets and graphic elements to support the company’s marketing and communication efforts.
Over the course of 1 year and 9 months, I contributed to shaping the product vision, making design decisions that improved usability and clarity, and ensuring the platform could handle the complexities of large-scale B2B data while remaining intuitive for end users.
Key Features of the Platform
The platform was built around a set of core features designed to support semiconductor companies in managing their components and supply chain risks:
- Reports Page – A centralized dashboard that visualizes insights from uploaded component lists, such as availability, compliance, pricing, and lifecycle risks.
- E&O (Excess & Obsolete) – Helps companies identify surplus or outdated parts and connect with potential buyers to reduce waste and recover value.
- Shortage – Enables users to detect critical component shortages, share requirements, and receive supplier offers to secure parts faster.
- PPV+ (Purchase Price Variance) – Provides real-time analysis of purchase prices against market benchmarks, helping companies optimize procurement strategies.
- AI Assistant – An intelligent chatbot that allows users to interact with the system conversationally, ask complex questions, and receive instant data-driven insights.
Together, these features created a comprehensive SaaS solution that combined advanced data analysis with practical workflows to make the semiconductor supply chain more transparent, efficient, and resilient.
Reports Page
The Reports Page acted as the analytical core of the platform. Whenever a company uploaded a component list, the system automatically processed the data and generated a comprehensive report. This page was designed to transform raw data into clear, actionable insights through visual dashboards and metrics.
Key elements included:
- Match Rate – Showed what percentage of the uploaded items were found in the global database, with a breakdown of perfectly matched, semi-matched, and unmatched items.
- Lead Time – Displayed the shortest and longest lead times for listed items, helping companies anticipate delays in the supply chain.
- Lifecycle Status – Categorized items as active, discontinued, or end-of-life, and flagged components with low, medium, or high risk.
- RoHS Compliance – Indicated whether parts complied with environmental regulations, an essential factor for global trade.
- Stock Availability – Revealed what proportion of items were currently available in the market, highlighting possible shortages.
- Total Price Analysis – Compared the list’s standard price with the selling price, helping buyers and sellers evaluate pricing strategies.
By consolidating all this information in a single dashboard, the Reports Page gave users a 360-degree view of their inventory health. Beyond analysis, users could also share reports directly with suppliers, turning insights into immediate opportunities for negotiation or collaboration.
E&O (Excess & Obsolete)
The E&O feature was designed to help companies identify and manage surplus or obsolete components in their inventory. In the semiconductor industry, holding excess parts not only ties up capital but also creates a risk of waste if those items lose relevance or reach end-of-life.
E&O List Page
This page displays the list of Excess & Obsolete (E&O) components. Each item includes details such as supplier, quantity, selling price, market price, and lifecycle status. Features like Market Pulse and Sync Price allow users to keep pricing updated and quickly identify trading opportunities.
Availability & Market Insights
This analytical dashboard provides insights into global availability and pricing trends. Key metrics include total availability, weekly averages, today’s median price, estimated days of supply, and historical procurability. The Availability Trend chart visualizes changes over time, helping companies evaluate risks and anticipate market fluctuations.
Customers Management
This section helps companies manage their customer base. Users can view and edit customer information such as organization, representative, email, phone number, and deal permissions. It provides structure and clarity for organizing client relationships and tracking who is eligible to engage in deals.
RFQ & Counter Offer
This page supports the process of Request for Quotation (RFQ) and negotiations. Users can review product details, proposed prices, and quantities, while also submitting counter offers. The system clearly indicates the RFQ status (e.g., Submitted, Confirmed, or Rejected), making the negotiation process transparent and efficient.
With this feature, users could:
- Upload component lists and instantly see which items were flagged as excess or obsolete.
- Analyze inventory risks through detailed lifecycle data, compliance checks, and pricing comparisons.
- Share the list with relevant partners or suppliers, creating opportunities to sell unused parts instead of writing them off.
- Recover value from otherwise stagnant inventory by connecting directly with companies that had active demand.
From a design perspective, the challenge was to present complex data (such as lifecycle status, risk levels, and compliance) in a way that was clear, visual, and actionable. The dashboard provided intuitive charts and indicators, enabling users to quickly spot at-risk items and make decisions about whether to sell, replace, or hold.
Ultimately, the E&O feature turned a common supply chain problem into a strategic opportunity, helping companies reduce waste, improve cash flow, and strengthen collaboration with industry peers.
Shortage
The Shortage feature was built to help companies quickly identify and resolve critical component shortages in their supply chain. In the semiconductor industry, shortages can disrupt production lines, delay projects, and cause significant financial loss. This feature was designed to give users real-time visibility into market availability and connect them directly with suppliers.
Shortage Items List
A tabular view of all shortage parts with key fields: MPN/IPN, Common Code, Status, Urgency, Resolution Time, Quantity, and Standard Price. Users can search, filter by attribute, switch view modes, and add items. Row actions (e.g., View Details) let teams drill into a part and kick off RFQs.
Customers (Share & Permissions)
The directory for selecting which customers/suppliers can see a shortage list and participate in deals. Each record shows organization, rep details, and deal permission. Users can add or edit contacts so shortage requests reach the right partners quickly.
Supplier Quote & Counter Offer
The negotiation workspace for a specific shortage RFQ. It surfaces the buyer’s standard/target entry, the supplier’s offer, and iterative counter-offers (price & quantity). Side actions enable routing to a Business Unit, then award or reject the quote—making the fulfillment loop fast and transparent.
With this feature, users could:
- Upload shortage lists and see which components were in limited supply.
- Analyze availability trends through metrics like total stock, median price, estimated days of supply, and historical procurability.
- Forecast risks by tracking how availability changes over time with trend charts.
- Request quotations (RFQs) directly from suppliers and negotiate through the platform, speeding up procurement.
- Collaborate with business units or external partners to secure critical parts before competitors.
From a design perspective, the challenge was to visualize scarcity in a clear and urgent way, while still giving users the tools to act on the information. By combining data dashboards with actionable workflows (like RFQ requests and counter-offers), the Shortage feature transformed a potential bottleneck into an opportunity for proactive supply chain management.
PPV+ (Purchase Price Variance)
The PPV+ feature was designed to give companies a transparent view of how their purchase prices compared to market benchmarks. In the semiconductor industry, even small variances in unit price can lead to significant cost differences across high-volume orders, so this feature was critical for procurement optimization.
PPV+ List
This page displays the PPV+ (Purchase Price Variance) list, where users can upload component data and compare their target prices with standard market prices. It provides transparency in procurement, helping buyers identify cost-saving opportunities and negotiate better deals with suppliers.
Customers Management (within PPV+)
This section allows users to manage their customer relationships in the context of PPV+. Each record shows the organization, representative details, and deal permissions. Users can add new customers or edit existing ones, ensuring that only authorized contacts can participate in bidding and negotiations.
Offer & Negotiation Page
This page supports the negotiation workflow for PPV+. It presents the target price from the buyer, the supplier’s offer, and multiple counteroffers. Users can adjust price and quantity until both sides reach an agreement. The clear step-by-step interface makes the process of confirming or rejecting offers efficient and transparent.
With PPV+, users could:
- Upload lists of components with their target or internal purchase prices.
- Compare against real-time market prices, highlighting cost gaps and opportunities for savings.
- View offers from multiple suppliers in one place and track how many responses each list received.
- Negotiate directly within the system, using counter-offers to arrive at a mutually beneficial deal.
- Share PPV+ lists with trusted suppliers, ensuring only authorized partners had access to sensitive pricing data.
From a design perspective, the challenge was balancing complex procurement data (target vs. standard prices, supplier offers, counteroffers) with a clean and navigable interface. Tables were structured to make large datasets scannable, and negotiation screens were simplified into step-by-step flows so users could quickly decide whether to accept, reject, or counter an offer.
Ultimately, PPV+ empowered procurement teams to reduce costs, gain pricing leverage, and strengthen supplier negotiations—all while working in a centralized, transparent environment.
AI Assistant
The AI Assistant was introduced as an intelligent layer on top of the platform to help users interact with their data conversationally instead of navigating through multiple dashboards. Its purpose was to simplify complex workflows and provide instant answers to common business questions.
AI ASSISTANT
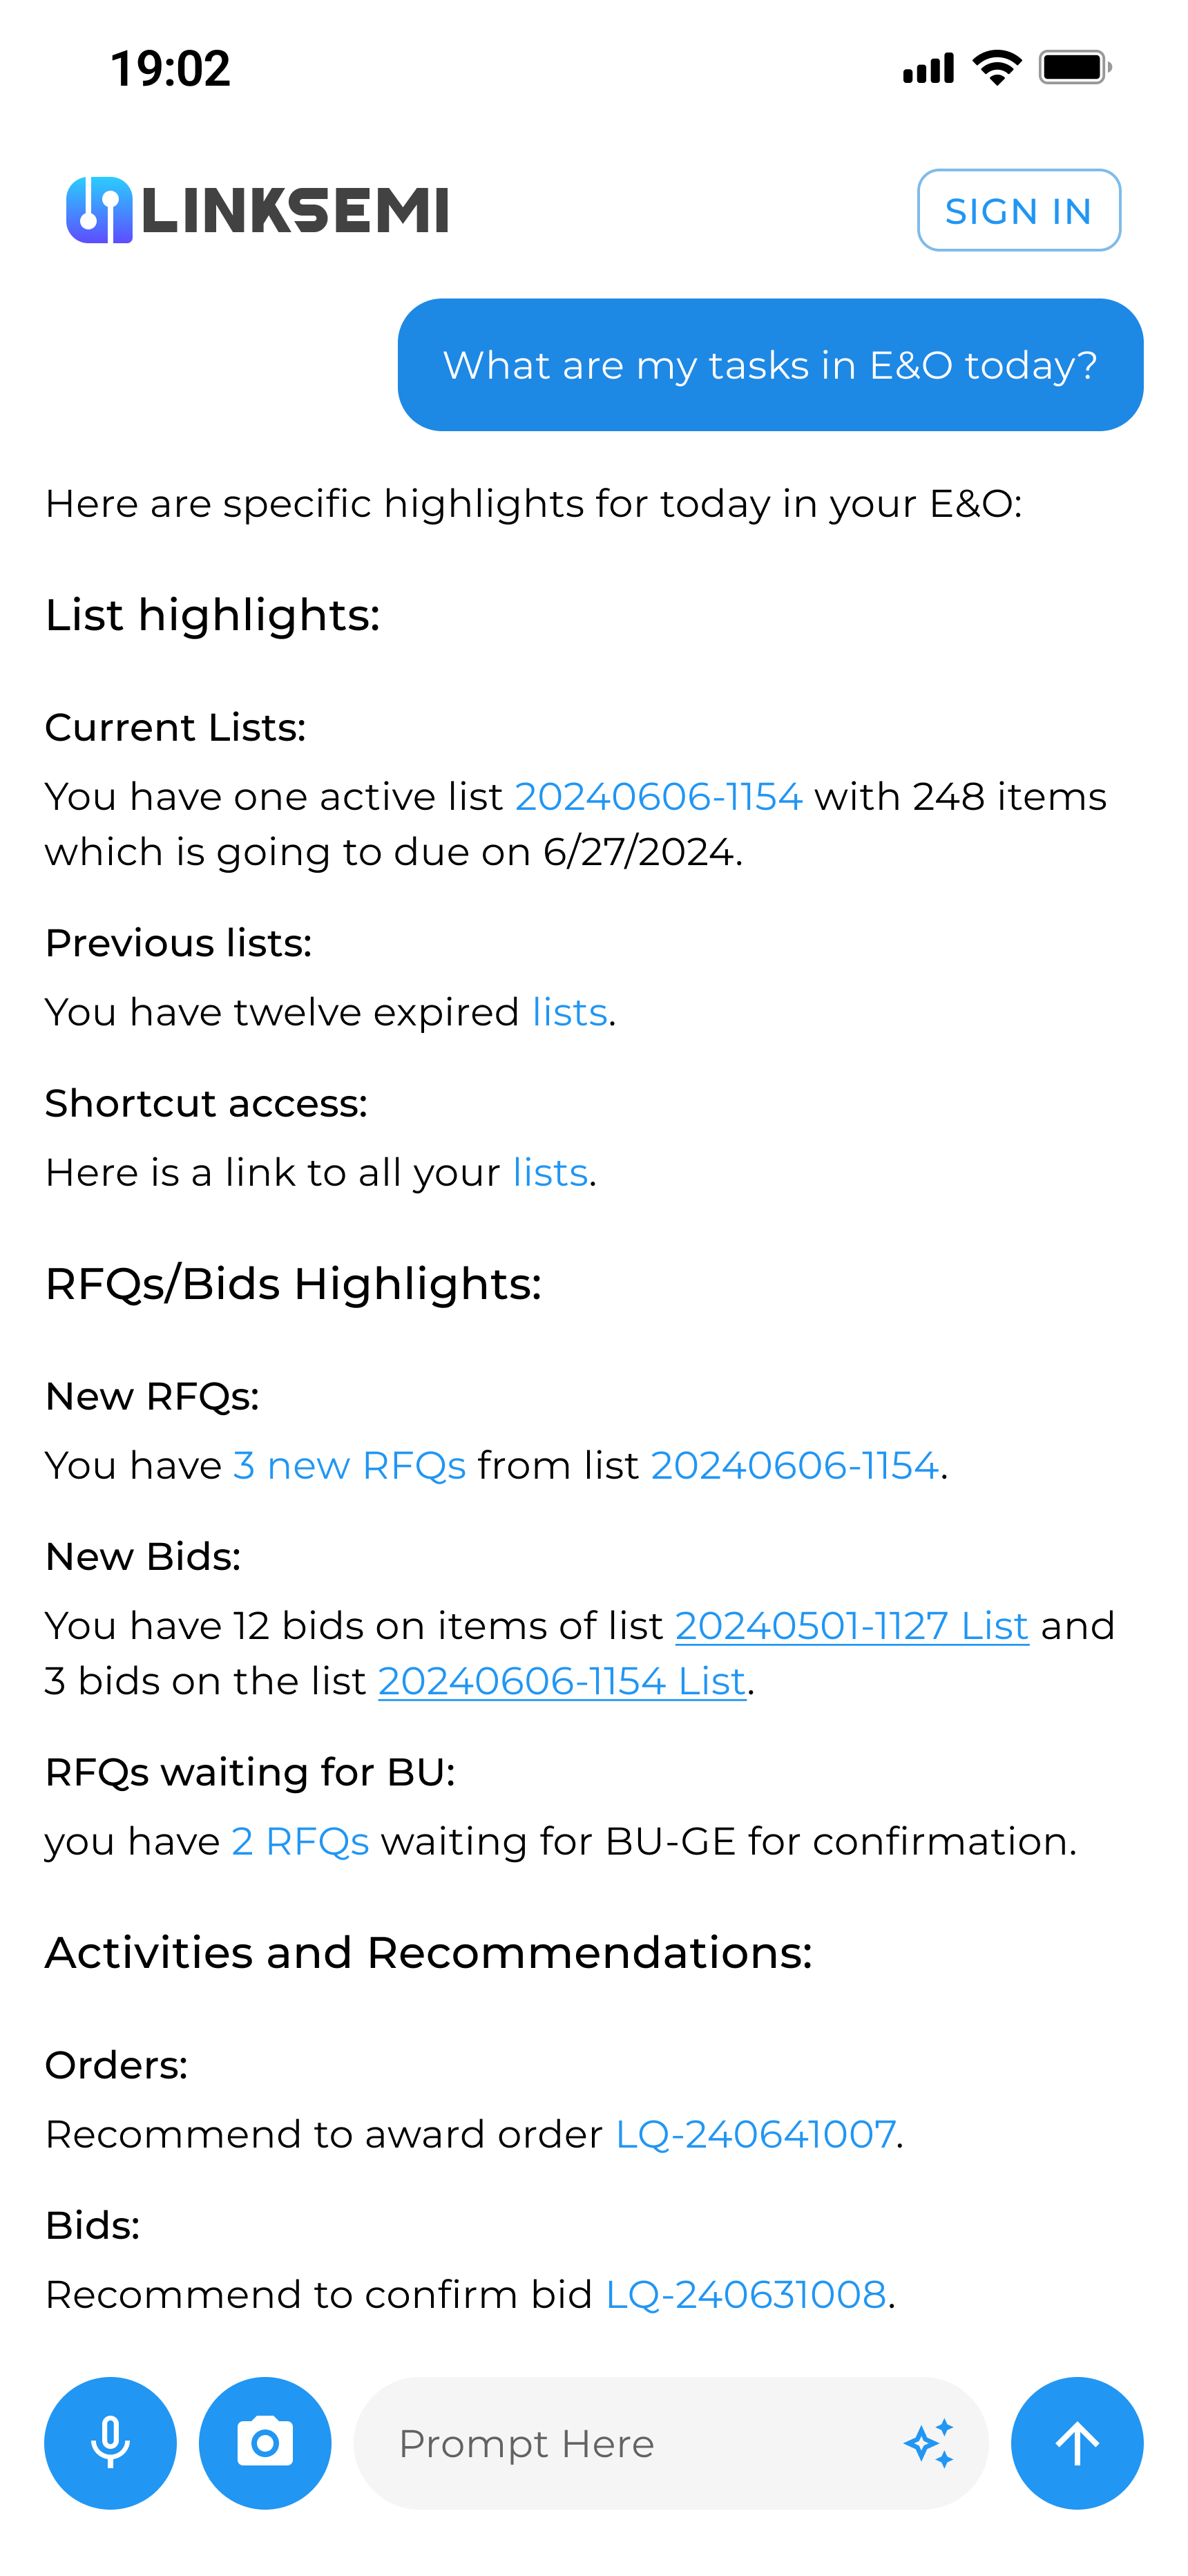
Mobile AI Assistant
On mobile, the AI Assistant delivers daily highlights at a glance. Users can see active and expired lists, new RFQs, bids, and pending confirmations. It also provides direct recommendations, such as awarding an order or confirming a bid. This design makes it easy for users to stay on top of critical tasks while on the go, without needing to navigate through multiple dashboards.
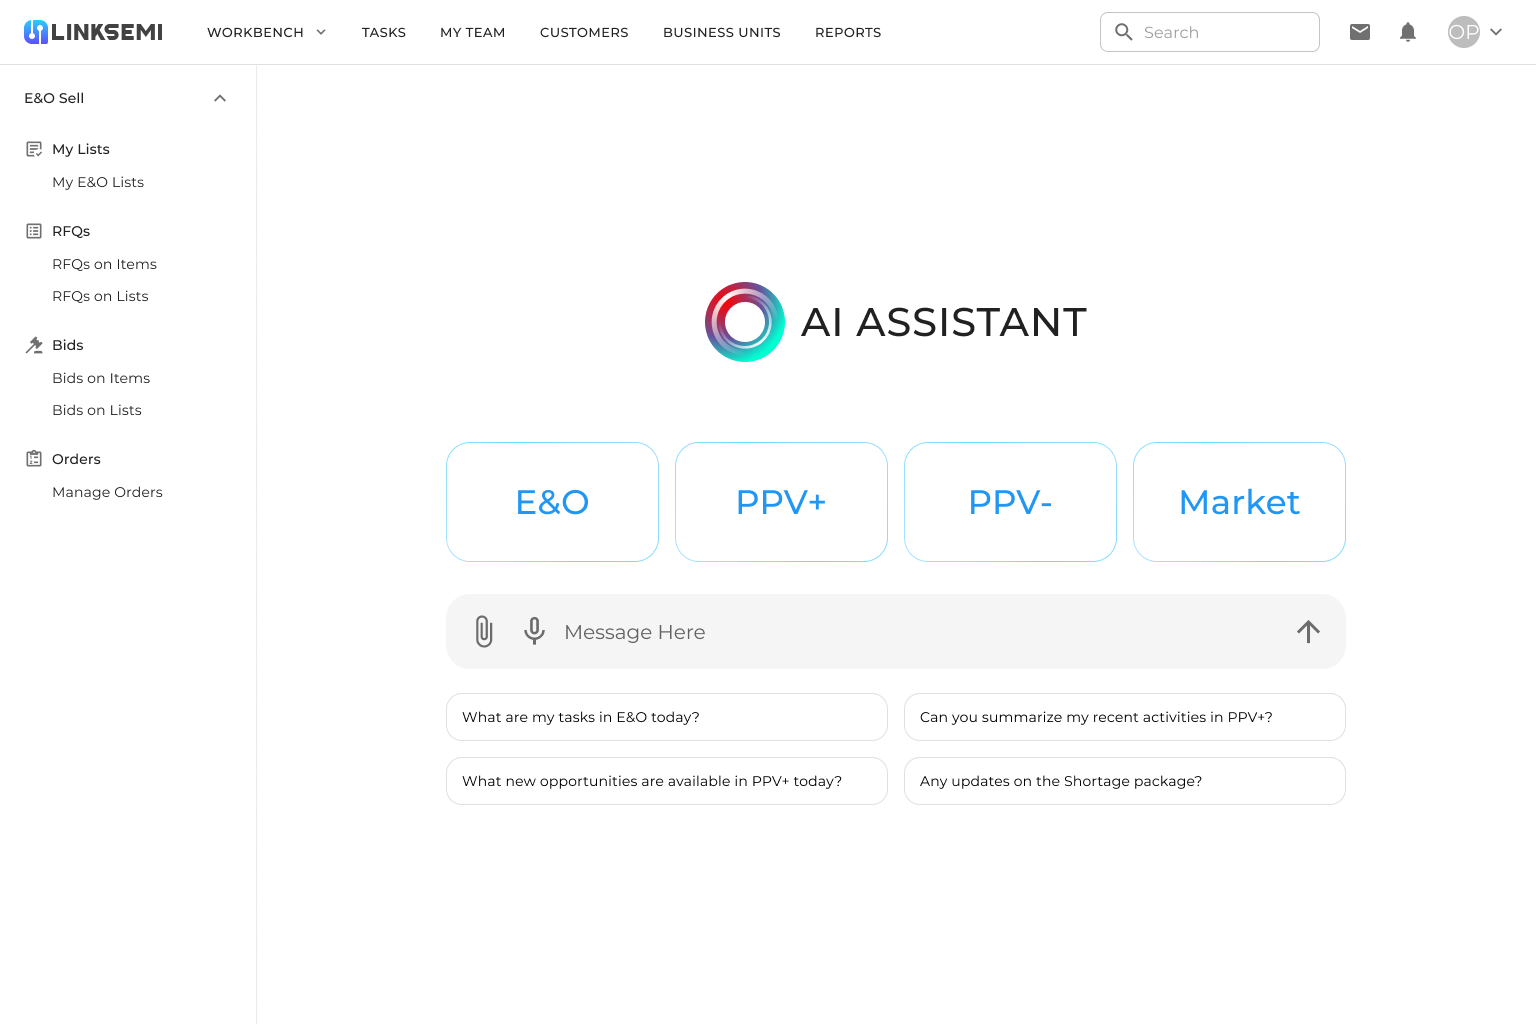
Desktop AI Assistant
On desktop, the AI Assistant acts as a central conversational hub. Users can type or speak natural language questions and instantly access insights across E&O, Shortage, and PPV+. Quick-action buttons and suggested prompts guide users to common tasks, turning complex workflows into simple conversations. This creates a more human-centered experience for managing supply chain data.
With the AI Assistant, users could:
- Ask questions in natural language, such as “What are my tasks in E&O today?” or “Can you summarize my recent activities in PPV+?”.
- Get daily highlights: active or expired lists, new RFQs, pending bids, and recommendations for orders or confirmations.
- Access shortcut insights directly (e.g., open specific lists or see which RFQs are waiting for business unit approval).
- Navigate across features (E&O, Shortage, PPV+) through quick-action buttons instead of manual searching.
- Use it seamlessly on both web and mobile, making insights available anywhere.
From a design perspective, the challenge was to balance simplicity with depth: the interface had to feel as easy as chatting with a colleague while still giving access to highly detailed supply chain data. By surfacing personalized highlights, proactive recommendations, and shortcuts, the AI Assistant reduced cognitive load and turned a complex B2B platform into a human-centered experience.
Conclusion
Designing for Linksemi was a unique opportunity to work on a B2B SaaS platform in the semiconductor industry, where I focused on turning highly complex data and workflows into clear, intuitive, and user-friendly experiences. Over the course of 1 year and 9 months, I collaborated closely with the product team to define and design multiple product features, ensuring usability and scalability for a data-heavy platform.
Although the product delivered strong value for semiconductor companies by improving transparency and decision-making, the startup faced challenges beyond product development. Due to difficulties in attracting investment, Linksemi ceased operations in December 2024.
Despite this outcome, the experience gave me invaluable lessons in designing for complex B2B systems, aligning business needs with user goals, and building digital products in a highly technical and competitive space.
Contact
I’m always excited to connect and explore new ideas.Let’s create something meaningful together.
© 2025 Sam Miri. All rights reserved.
